
|
Fig. 1
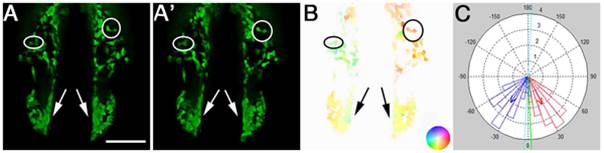
Optical Flow analyses of net cell movement.
(A, A′) Two consecutive frames of a time-lapse movie. B) Optical Flow analysis yields a vector field that is represented in a color-coded manner. As shown in the inset, color hue represents direction of movement and color intensity represents magnitude of movement. C) Polar histogram showing the distribution of the summed angles of motion vectors detected by OF. Blue and red bars depict binned movement in the left and right side of the field, respectively. Red and blue arrows represent the average vector of movement, and the green arrow is the average vector over the whole field. Scale Bar = 50 µm. Anterior movements are toward the bottom of the page.