
Image
|
Figure Caption
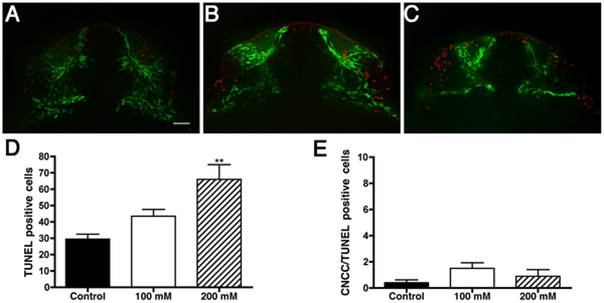
Fig. 8
Ethanol increases non-specific cell death.
Fluorescent images showing cell death (red) and CNCC (green) in A) Control, B) 100 mM EtOH and C) 200 mM EtOH treated sox10:EGFP 24 hpf embryos. D) Variance analysis reveals a significant increase in the number TUNEL positive cells (p<0.0007; n = 10 per treatment) throughout the craniofacial area. E) The number of CNCC positive for both EGFP and TUNEL are: control = 0.4 cells, 100 mM = 1.5 cells, and 200 mM = 0.9 cells. Error bars = SEM. Frontal views: dorsal to the top. Scale bar = 20 µm.
Acknowledgments
This image is the copyrighted work of the attributed author or publisher, and
ZFIN has permission only to display this image to its users.
Additional permissions should be obtained from the applicable author or publisher of the image.
Full text @ PLoS One