
Fig. 2
- ID
- ZDB-FIG-150427-25
- Publication
- Boric et al., 2013 - Quantitative analysis of cell migration using optical flow
- Other Figures
- All Figure Page
- Back to All Figure Page
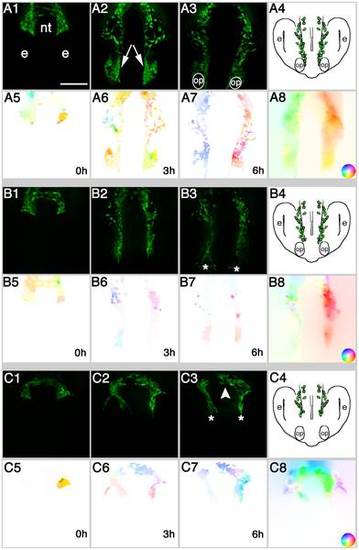
Analysis of cell migration at the population level reveals EtOH induced differences in CNCC migration patterns. Representative examples of A) Control, embryos treated in B) 100 mM and C) 200 mM EtOH. 1–3) Video frames captured from time-lapse movies at beginning (0 h) middle (3 h) and end (6 h) of the recording period. 4) Cartoon of a 20–22 somite embryo, showing location of CNCC (green) at the end of migration. 5–7) Color-coded image showing the movement vectors detected by OF analysis. 8) Movement vectors summed for the complete six-hour sequence. The inset is the color scale representing direction and magnitude of movement. Color intensity represents movement magnitude and a given color hue represents the movement’s direction. Dorso-Frontal views: posterior to the top. Scale Bar = 50 µm. nt = neural tube, e = developing eye, op = olfactory placode. Anterior movements are toward the bottom of the page. |