
- Title
-
Compensatory regulation of Na+ absorption by Na+/H+ exchanger and Na+-Cl- cotransporter in zebrafish (Danio rerio)
- Authors
- Chang, W.J., Wang, Y.F., Hu, H.J., Wang, J.H., Lee, T.H., and Hwang, P.P.
- Source
- Full text @ Front. Zool.
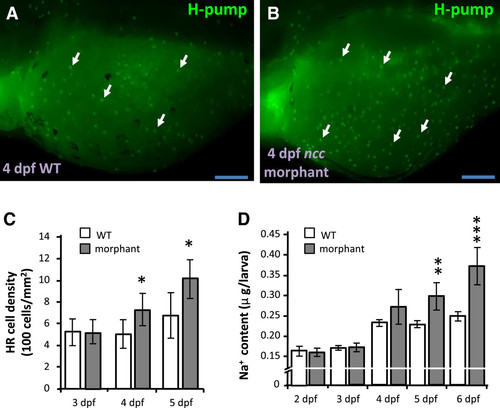
Knockdown of ncc increases HR cell number and Na+ accumulation. (A, B): H+-ATPase (H-pump) immunostaining signals (arrow) in 4-dpf wild type larvae (WT) and ncc morphants. Scale bar = 100 μm. (C, D): Comparisons of HR cell density (C) and whole body Na+ content (D) between wild type larvae (white bars) and ncc morphants (gray bars) at different developmental stages (n = 8 in C and 6 in D). Mean ± SD. *p < 0.05; **p < 0.01; ***p < 0.001 (Student’s t-test). |

Loss of HR cells by gcm2 knockdown increases NCC cell number and Na+ absorption ability. (A, B): Immunostaining images of NCC cells (arrow) in 4-dpf wild type larvae (WT) and gcm2 morphants. Scale bar = 100 μm. (C): Comparison of NCC cell density between wild type larvae (white bars) and gcm2 morphants (gray bars) at different developmental stages (n = 8). (D): Na+ influx in 4-dpf wild types, gcm2 morphants, and foxi3a/3b morphants (n = 6). (E): Whole body Na+ content in wild type larvae (white bars) and gcm2 morphants (gray bars) at different developmental stages (n = 6). Mean ± SD. *p < 0.05 (Student’s t-test). EXPRESSION / LABELING:
PHENOTYPE:
|
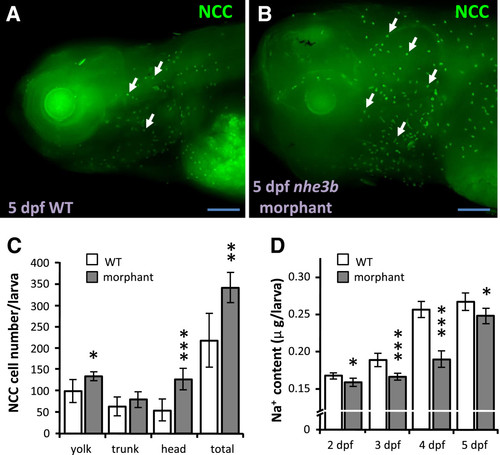
Knockdown of nhe3b increases NCC cell number. (A, B): NCC (arrow) immunostaining images of 5-dpf wild type larvae (WT) and nhe3b morphants. Scale bar = 100 μm. (C): Comparison of NCC cell number in different areas between 5-dpf wild type larvae (white bars) and nhe3b morphants (gray bars) (n = 8). (D): Whole body Na+ content in wild type larvae (white bars) and nhe3b morphants (gray bars) at different developmental stages (n = 6). Mean ± SD. *p < 0.05; **p < 0.01; ***p < 0.001 (Student’s t-test). |
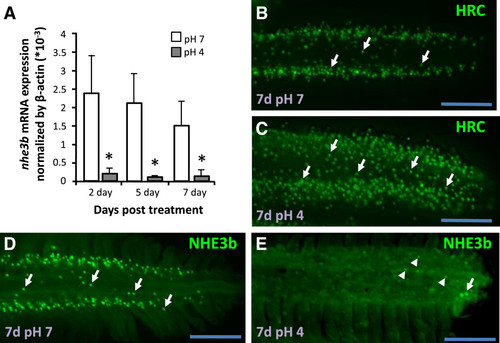
Down-regulation of nhe3b in gills under acid stress. (A): Expression of nhe3b mRNA in gills treated with control pH7 FW (white bars) or acidic pH4 FW (gray bars) for the indicated days. Mean ± SD (n = 6). *p < 0.05 (Student’s t-test). (B-E): Immunostaining images of H+-ATPase (H-pump) and NHE3b in gills from adult zebrafish maintained in pH7 FW (B, D) or pH4 FW (C, E) for 7 d. Arrow, NCC or NHE3b signal; arrow head, weaker NHE3b signal. Scale bar = 100 μm. |
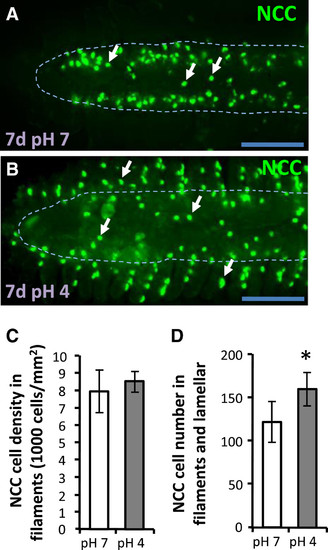
NCC is up-regulated in gills under acid stress. (A, B): Immunostaining images of NCC (arrow) in gills filaments under pH7 or pH4 FW for 7d. (C, D): Comparisons of NCC cell density in gill filaments (C) and of NCC cell number in both gill lamella and filament (D) between pH7 (white bars) and pH4 FW (gray bars) for 7d. Means ± SD (n = 8). *p < 0.05 (Student’s t-test). Scale bar = 100 μm. |
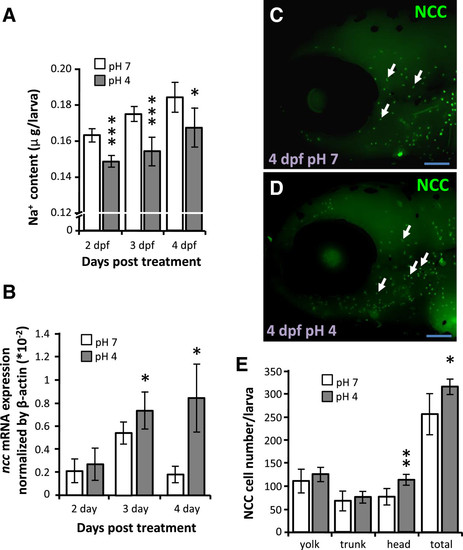
Effects of acid stress on Na+ accumulation and NCC expression in zebrafish larvae. (A, B): Comparison of whole body Na+ content (A) and ncc mRNA expression (B) in larvae treated with control pH7 (white bars) or acidic pH4 FW (gray bars) for 4 d. Mean ± SD (n = 6). (C, D): Immunostaining images of NCC (arrow) in 4-dpf larvae under pH7 or pH4 FW for 4 d. Scale bar = 100 μm. (E): Comparison of NCC cell number in different areas of 4-dpf larvae treated with pH7 (white bars) or pH4 FW (gray bars) (n = 8). *p < 0.05; **p < 0.01; ***p < 0.001 (Student’s t-test). |
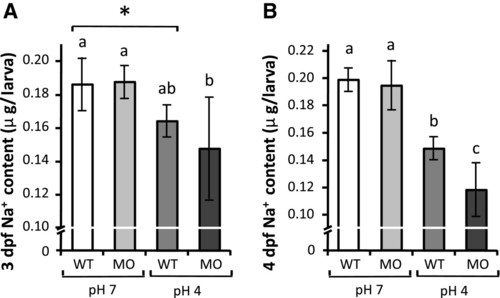
Effect of ncc knockdown on Na + accumulation in zebrafish larvae under acid stress. (A, B): Whole body Na+ content in wild type (WT) larvae and ncc morphants (MO) treated with control pH7 or acidic pH4 FW for 3 d (A) or 4 d (B). Mean ± SD (n = 6). *p < 0.05 (Student’s t-test). abcsignificant difference (One-way ANOVA, Tukey’s multiple-comparison). PHENOTYPE:
|
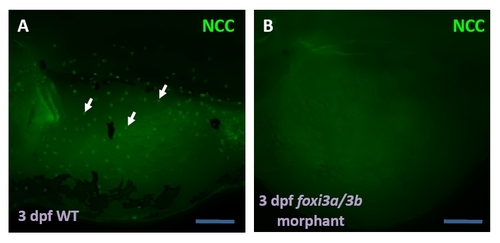
Double knockdown of foxi3a and foxi3b blocks NCC cell differentiation in 3-dpf morphants (MO). Arrows indicate immunostaining for NCC in wild type embryos (WT). Scale bar = 100 μm. EXPRESSION / LABELING:
PHENOTYPE:
|

Sampling and quantifying methods for cell number and cell density. A: The 12 selected areas for measuring NCC and HR cell densities in the embryonic yolk sac surface. Unit area: 100 × 100 μm2. B: Regions of embryonic skin: head (I), yolk (II), and trunk (III). Scale bar = 100 μm. C: The middle part of 2nd gill arch for sampling and immunostaining. C-1, Areas of the gill filament (250 μm in total length) selected for cell density measurements. C-2, The area (filament and lamella within 250 µm in length) selected for determining total cell number. |

Specificity and effectiveness of ncc and nhe3b morpholinos. Western blot analysis was conducted to detect the protein expression of NHE (A) and NCC (B). Three-dpf wild type larvae (WT), nhe3b morphants (NHE MO), and ncc morphants (NCC MO) were sampled for the analysis. Arrows indicate the protein with the predicted size. β-actin was used as internal control. EXPRESSION / LABELING:
|