
Image
|
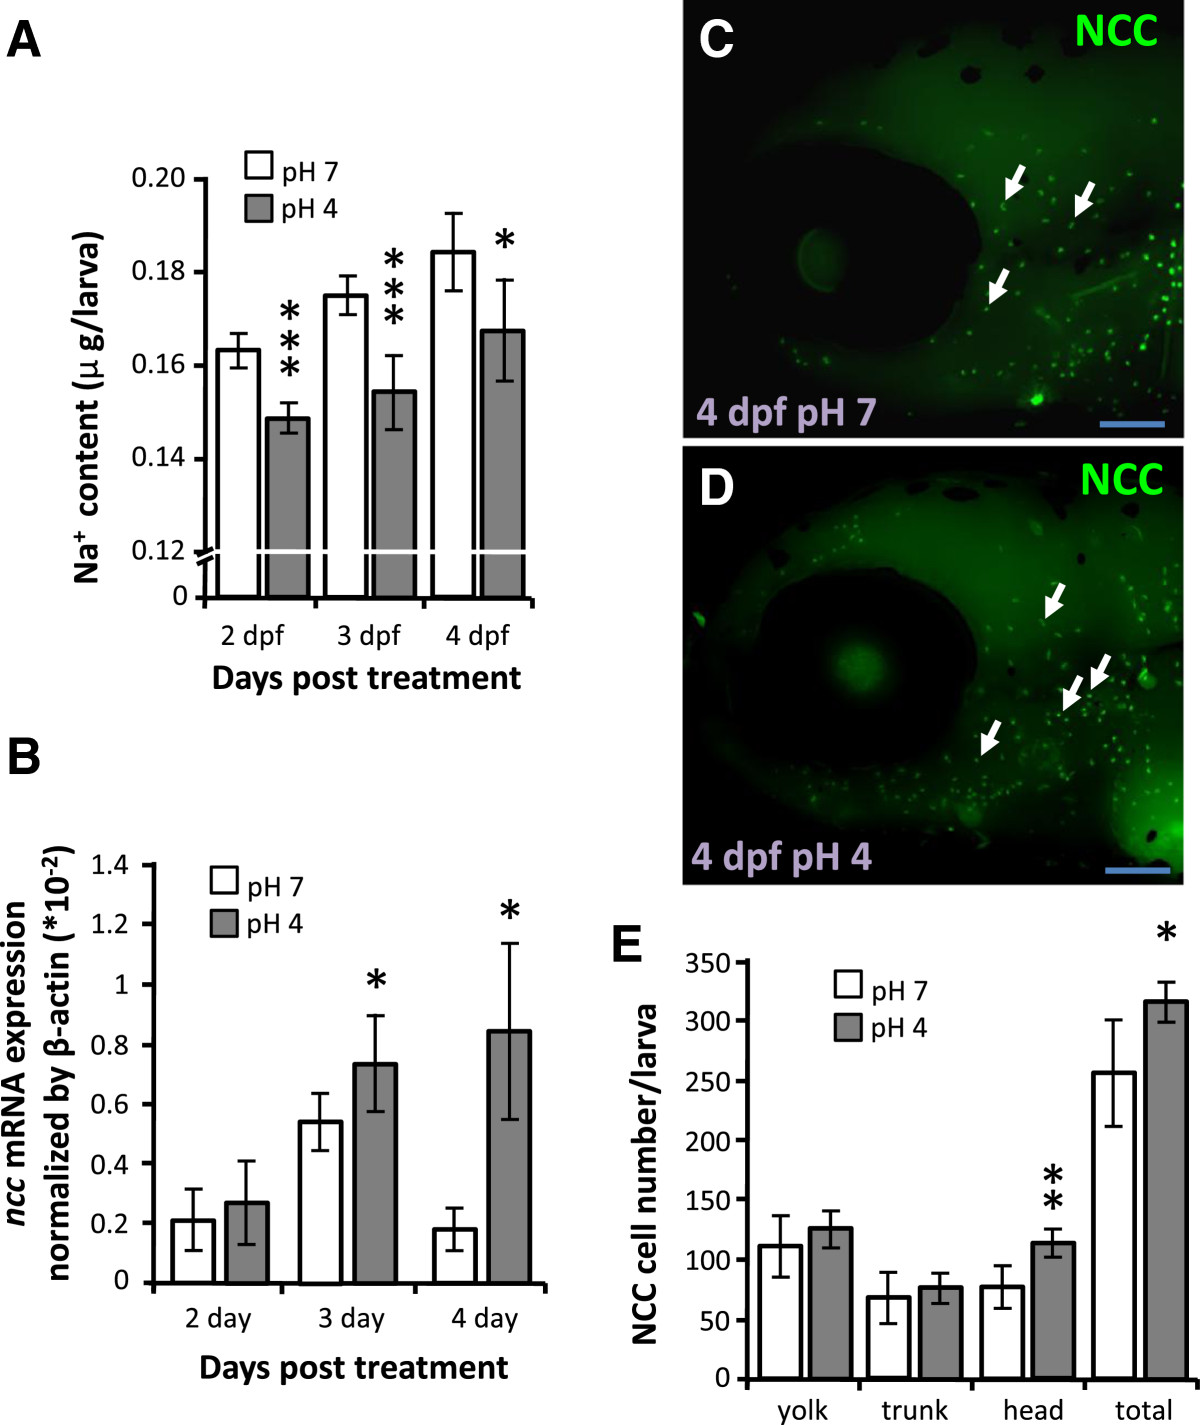
Figure Caption
Fig. 6
Effects of acid stress on Na+ accumulation and NCC expression in zebrafish larvae. (A, B): Comparison of whole body Na+ content (A) and ncc mRNA expression (B) in larvae treated with control pH7 (white bars) or acidic pH4 FW (gray bars) for 4 d. Mean ± SD (n = 6). (C, D): Immunostaining images of NCC (arrow) in 4-dpf larvae under pH7 or pH4 FW for 4 d. Scale bar = 100 μm. (E): Comparison of NCC cell number in different areas of 4-dpf larvae treated with pH7 (white bars) or pH4 FW (gray bars) (n = 8). *p < 0.05; **p < 0.01; ***p < 0.001 (Student’s t-test).
Figure Data
Acknowledgments
This image is the copyrighted work of the attributed author or publisher, and
ZFIN has permission only to display this image to its users.
Additional permissions should be obtained from the applicable author or publisher of the image.
Full text @ Front. Zool.