
- Title
-
Modelling human Wiskott-Aldrich syndrome protein mutants in zebrafish larvae using live in vivo imaging
- Authors
- Jones, R.A., Feng, Y., Worth, A.J., Thrasher, A.J., Burns, S.O., and Martin, P.
- Source
- Full text @ J. Cell Sci.
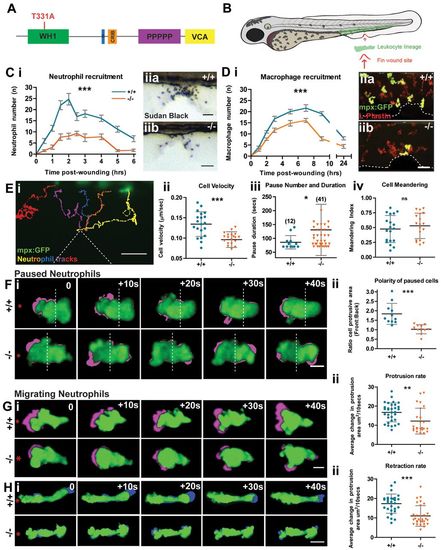
The Zebrafish WASp mutant has a defect in leukocyte wound recruitment. (A) Schematic of WASp protein domains with the site of the STOP codon in washu3280 mutant indicated (red). (B) Schematic of 3dpf zebrafish larva showing haematopoietic cell location (green) and wound (red arrow). (C) Time course of Sudan-Black-positive neutrophil recruitment in WT versus mutant larvae (i). Two-way ANOVA, Bonferroni post-test at each time-point 0.5hour (NS), 1hour (***), 1.5hours (***), 2hours (***), 2.5hours (**), 3hours (***), 4hours (**), 5hours (***), 6hours (NS). Representative images of Sudan-Black-stained neutrophils recruited to the 90minute wound site (ii) in WT (a) and mutant (b). (D) Time-course of macrophage recruitment in WT versus mutant mpx:GFP+ larvae (i). Two-way ANOVA, Bonferroni post-test at each time point 1hour (NS), 2hours (*), 3hours (**), 5hours (***), 7hours (***), 9hours (***), 24hours (NS). Representative images of 3hour wounds immunostained for L-Plastin to reveal all leukocytes (red) and mpx:GFP+ neutrophils (green) at the wound site (ii) in WT (a) and mutant (b). (E) Representative tracking analysis of mpx:GFP+ neutrophils during the first 90minutes post wounding of a WT larva (i); each neutrophil track is in a different colour and the wound is indicated by dotted lines. Graphic representation of the velocity of migrating cells (µm/second) (ii), pause duration (seconds) with number of pauses >1minute during wound migration (in brackets) (iii) and cell meandering index (iv), taken from tracks of WT (n = 20) and mutant (n = 20) mpx:GFP+ neutrophils. (F–H) Sample still images from confocal movies to illustrate protrusion/retraction analysis (i); neutrophils are green and new protrusive areas are indicated in magenta (F,G); and the retracting uropod in blue (H). WT cells exhibit greater persistence of polarity towards the wound (red asterisk). (F) (ii) Comparison of protrusive area (front versus back ratio analysis) in paused cells of WT vs mutant larvae. (G) (ii) As in F, but for migrating WT versus mutant cells, showing reduced protrusion in mutant cells. (H) (ii) Retraction analysis applied to migrating WT versus mutant cells, revealing mutant has defect in rate of uropod retraction. Error bars: s.e.m. (C,D); s.d. (E–H); *P<0.05; **P<0.01; ***P<0.001 by one-way ANOVA (C,D) and Student′s t-test (E–H). NS, not significant. Scale bars: 10μm (C,D); 20μm (E); 5μm (F–H). EXPRESSION / LABELING:
PHENOTYPE:
|

The Zebrafish WASp mutant can be rescued to varying degrees by introduction of WT hWASp and clinical WASp mutants. (A) Schematic of hWASp indicating the various mutant constructs for attempted rescue of the zebrafish mutant phenotype. (B) (i) lyz:Gal4-VP16 UAS:Kaede to reveal neutrophils (green), shows evidence of neutropenia only in the flanks of -/hWASpI294T ‘rescued larvae’ with (ii) quantification of neutrophil deficiency by measurement of total neutrophil area in the hematopoietic region. (C) Degree of ‘rescue’ of neutrophil recruitment at 2hours post wounding, after expression of hWASp constructs in the mutant background. (D) Tracking analysis of neutrophils following expression of each of the hWASp mutant constructs: (i) Quantification of the velocity of migrating cells (µm/sec), and (ii) pause duration (seconds), and pause number (in brackets). (E) Example still images from confocal time-lapse movies to illustrate protrusion analysis (magenta) applied to migrating hWASp mutant ‘rescues’ (see supplementary material Movie 1). Direction of the wound indicated by white arrow. (F) Quantification of rate of protrusion (i) and retraction (ii) in migrating hWASp mutant ‘rescues’. Error bars (s.d); asterisks denote significance values of *P<0.05, **P<0.01 and ***P<0.001 by one-way ANOVA. Scale bars: 100μm (B); 10μm (E). EXPRESSION / LABELING:
PHENOTYPE:
|
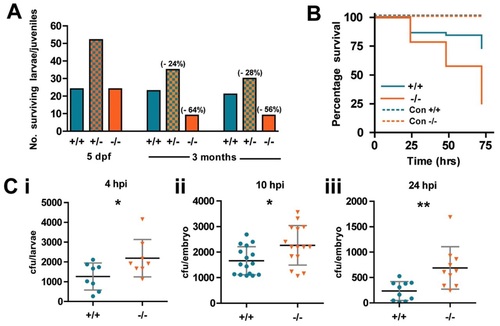
WASp mutant larvae show increased susceptibility to death from bacterial infection. (A) Ratio of genotypes of the offspring from WASp heterozygous in-crossed adults at 5dpf and 3 months. Values in brackets indicate percentage drop in survival from predicted Mendelian ratio for WASp+/- and WASp-/- larvae. (B) Survival curves for WT (n = 44) versus mutant (n = 43) zebrafish larvae injected at 52hpf with S. aureus; control injection is with PBS, WT (n = 15) mutant (n = 18). (C) Colony-forming unit (cfu) counts of individual larvae injected with 1200cfu of S. aureus at (i) 4hours post injection (hpi), WT (n = 8), mutant (n = 8); (ii) 10hpi, WT (n = 16), mutant (n = 15); (iii) 24hpi, WT (n = 10), mutant (n = 10). Error bars (s.d); asterisks denote significance values of *P<0.05, **P<0.01 using Student′s t-test. PHENOTYPE:
|
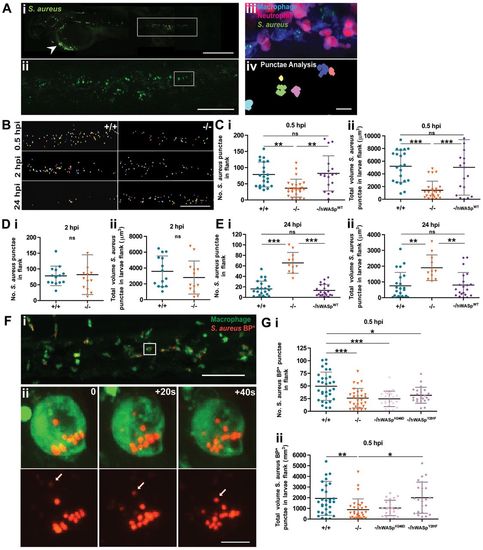
WASp mutant larvae show a delay in phagocytosis and defective clearance of S. aureus. (A) (i) Representative image of an infected larva. Arrowhead indicates injection site. (ii) GFP+ clumps of phagocytosed S. aureus visible in flank region (corresponding to white rectangle in i). (iii) Further magnification (corresponding to white square in ii) reveals a cluster of macrophages (blue) and neutrophils (magenta) with phagocytosed S. aureus (green) visible only within the macrophage population; (iv) application of punctae analysis using Volocity enables quantification of phagocytosed (as opposed to individual, not yet engulfed) S. aureus. (B) Representative images of bacterial punctae analysis in flanks of WT (+/+) versus mutant (/) larvae, revealing a delay in initial engulfment at 0.5hpi, catch up by 2hpi, but eventual failure to clear the phagocytosed bacteria at 24hpi, in the mutant. (C–E) Scatter plots of (i) numbers of S. aureus punctae and (ii) total volume of S. aureus punctae (µm3) in flanks of WT versus mutant larvae at. Successful rescue of mutant defect at (C) 0.5hpi and (E) 24hpi following macrophage-specific re-expression of hWASpWT under csf1a:Gal4. (F) (i) Confocal image of PU1:GFP-positive macrophages (green) in the haematopoietic region of 2dpf larva 30minutes post injection of pHrodo S. aureus Bioparticles (red). (ii) Stills from a time-lapse movie, illustrating increasing fluorescence of a single pHrodo bioparticle following acidification in the macrophage phagosome (see supplementary material Movie 3). Arrows in single channel series indicate phagosome as it becomes acidified. (G) Scatter plots of numbers of pHrodo S. aureus bioparticle punctae (i), and total volume of punctae (μm3) (ii), in flanks of WT, mutant and hWASp mutant ‘rescued’ larvae at 0.5hpi. Error bars indicate s.d.; *P<0.05, **P<0.01 and ***P<0.001 via Student′s t-test (D) and one-way ANOVA (C,E,G). Scale bars: 200μm (Ai); 100μm (Aii,B); 10μm (Aiii); 50μm (Fi); 5μm (Fii). PHENOTYPE:
|
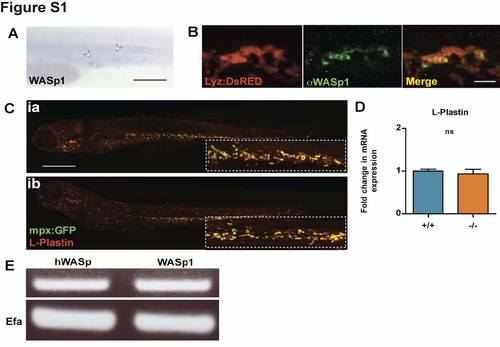
WASp1 is expressed in the hematopoietic lineages of Zebrafish larvae with WASp mutants showing no developmental defect in leukocyte numbers or distribution. (A) Whole-mount in situ hybridization for WASp1 in 1 dpf larvae, indicating expression in the early hematopoietic lineage (white arrowheads). (B) WASp1 antibody immunostaining depicting co-localisation with the transgenic neutrophil marker, lyz:DsRED in 3 dpf larvae. (C) WASp1 mutant has a normal distribution of leukocytes, as shown by L-Plastin immunostaining (red) in an mpx:GFP neutrophil transgenic line (green). (D) WASp1 mutant has a normal level of expression of the leukocyte marker Lplastin at 3 dpf, as shown by qPCR, indicating normal numbers of leukocytes. (E) RT-PCR showing transgenic expression of hWASp in “rescued” larvae is comparable to native levels of WASp1 transcript in WT larvae, with corresponding EFα control. Error bars (s.d). Scale bars: A, 100 μm; B, 10 μm; C, 200 μm. EXPRESSION / LABELING:
|