
Fig. 4
- ID
- ZDB-FIG-131210-24
- Publication
- Jones et al., 2013 - Modelling human Wiskott-Aldrich syndrome protein mutants in zebrafish larvae using live in vivo imaging
- Other Figures
- All Figure Page
- Back to All Figure Page
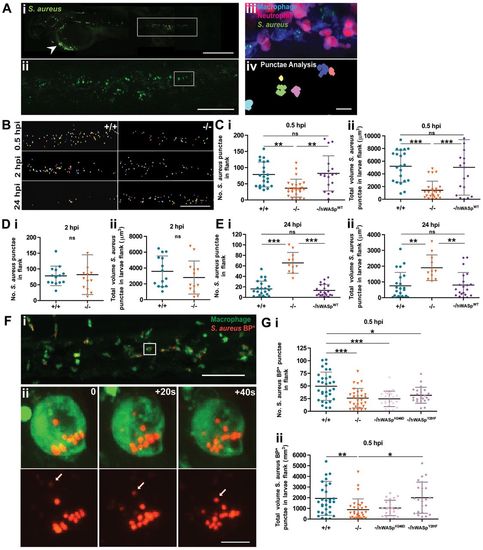
WASp mutant larvae show a delay in phagocytosis and defective clearance of S. aureus. (A) (i) Representative image of an infected larva. Arrowhead indicates injection site. (ii) GFP+ clumps of phagocytosed S. aureus visible in flank region (corresponding to white rectangle in i). (iii) Further magnification (corresponding to white square in ii) reveals a cluster of macrophages (blue) and neutrophils (magenta) with phagocytosed S. aureus (green) visible only within the macrophage population; (iv) application of punctae analysis using Volocity enables quantification of phagocytosed (as opposed to individual, not yet engulfed) S. aureus. (B) Representative images of bacterial punctae analysis in flanks of WT (+/+) versus mutant (/) larvae, revealing a delay in initial engulfment at 0.5hpi, catch up by 2hpi, but eventual failure to clear the phagocytosed bacteria at 24hpi, in the mutant. (C–E) Scatter plots of (i) numbers of S. aureus punctae and (ii) total volume of S. aureus punctae (µm3) in flanks of WT versus mutant larvae at. Successful rescue of mutant defect at (C) 0.5hpi and (E) 24hpi following macrophage-specific re-expression of hWASpWT under csf1a:Gal4. (F) (i) Confocal image of PU1:GFP-positive macrophages (green) in the haematopoietic region of 2dpf larva 30minutes post injection of pHrodo S. aureus Bioparticles (red). (ii) Stills from a time-lapse movie, illustrating increasing fluorescence of a single pHrodo bioparticle following acidification in the macrophage phagosome (see supplementary material Movie 3). Arrows in single channel series indicate phagosome as it becomes acidified. (G) Scatter plots of numbers of pHrodo S. aureus bioparticle punctae (i), and total volume of punctae (μm3) (ii), in flanks of WT, mutant and hWASp mutant ‘rescued’ larvae at 0.5hpi. Error bars indicate s.d.; *P<0.05, **P<0.01 and ***P<0.001 via Student′s t-test (D) and one-way ANOVA (C,E,G). Scale bars: 200μm (Ai); 100μm (Aii,B); 10μm (Aiii); 50μm (Fi); 5μm (Fii). |
| Fish: | |
|---|---|
| Condition: | |
| Observed In: | |
| Stage Range: | Long-pec to Protruding-mouth |