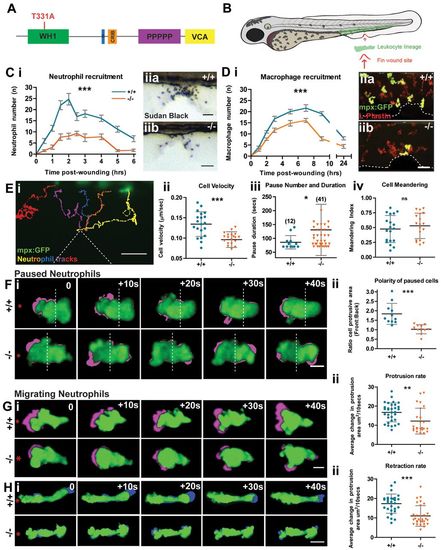
The Zebrafish WASp mutant has a defect in leukocyte wound recruitment. (A) Schematic of WASp protein domains with the site of the STOP codon in washu3280 mutant indicated (red). (B) Schematic of 3dpf zebrafish larva showing haematopoietic cell location (green) and wound (red arrow). (C) Time course of Sudan-Black-positive neutrophil recruitment in WT versus mutant larvae (i). Two-way ANOVA, Bonferroni post-test at each time-point 0.5hour (NS), 1hour (***), 1.5hours (***), 2hours (***), 2.5hours (**), 3hours (***), 4hours (**), 5hours (***), 6hours (NS). Representative images of Sudan-Black-stained neutrophils recruited to the 90minute wound site (ii) in WT (a) and mutant (b). (D) Time-course of macrophage recruitment in WT versus mutant mpx:GFP+ larvae (i). Two-way ANOVA, Bonferroni post-test at each time point 1hour (NS), 2hours (*), 3hours (**), 5hours (***), 7hours (***), 9hours (***), 24hours (NS). Representative images of 3hour wounds immunostained for L-Plastin to reveal all leukocytes (red) and mpx:GFP+ neutrophils (green) at the wound site (ii) in WT (a) and mutant (b). (E) Representative tracking analysis of mpx:GFP+ neutrophils during the first 90minutes post wounding of a WT larva (i); each neutrophil track is in a different colour and the wound is indicated by dotted lines. Graphic representation of the velocity of migrating cells (µm/second) (ii), pause duration (seconds) with number of pauses >1minute during wound migration (in brackets) (iii) and cell meandering index (iv), taken from tracks of WT (n = 20) and mutant (n = 20) mpx:GFP+ neutrophils. (F–H) Sample still images from confocal movies to illustrate protrusion/retraction analysis (i); neutrophils are green and new protrusive areas are indicated in magenta (F,G); and the retracting uropod in blue (H). WT cells exhibit greater persistence of polarity towards the wound (red asterisk). (F) (ii) Comparison of protrusive area (front versus back ratio analysis) in paused cells of WT vs mutant larvae. (G) (ii) As in F, but for migrating WT versus mutant cells, showing reduced protrusion in mutant cells. (H) (ii) Retraction analysis applied to migrating WT versus mutant cells, revealing mutant has defect in rate of uropod retraction. Error bars: s.e.m. (C,D); s.d. (E–H); *P<0.05; **P<0.01; ***P<0.001 by one-way ANOVA (C,D) and Student′s t-test (E–H). NS, not significant. Scale bars: 10μm (C,D); 20μm (E); 5μm (F–H).
|
