
- Title
-
High Cholesterol Diet Induces IL-1beta Expression in Adult but Not Larval Zebrafish
- Authors
- Yoon, Y., Yoon, J., Jang, M.Y., Na, Y., Ko, Y., Choi, J.H., and Seok, S.H.
- Source
- Full text @ PLoS One
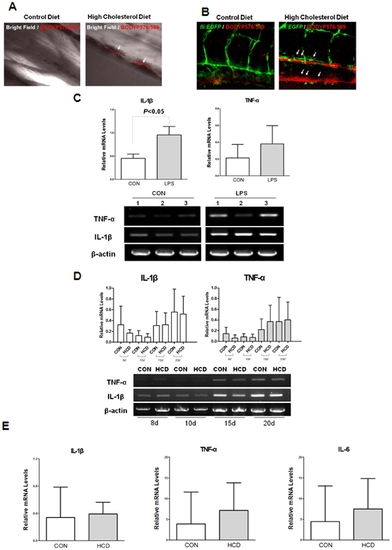
Lipid accumulation and pro-inflammatory cytokine level in zebrafish larvae. A and B, Five-day old wild (A) and fli1:EGFP (B) zebrafish larvae were fed a 4% cholesterol-enriched (HCD) or a normal (control) diet for 10 days, both supplemented with a 10 μg/g red fluorescent lipid. Images of the caudal vasculature in live larvae show vascular lipid accumulation visualized by lipid-associated BODIPY 576/589 fluorophore deposits in HCD fed larvae. The larger lipid deposits were found at the bifurcation site (arrows). Scale = 40 μm. C. Increased expressions of IL-1β and TNF-α by 3 h LPS treatment at 2-day old zebrafish larvae. Semi-quantitative PCR was performed for IL-1β and TNF-α in triplicate (n = 20 zebrafish larvae per group) D. Semi-quantitative PCR for IL-1β and TNF-α expressions from zebrafish larvae fed a HCD enriched with 4% cholesterol or normal (control) diet for 8 days to 20 days. The experiment was performed in triplicate (n = 15~20 zebrafish larvae per group) E. Realtime RT-PCR analysis for the expression levels of IL-1β, TNF-α and IL-6 from zebrafish larvae fed a HCD enriched with 4% cholesterol or normal (control) diet for 10 days. Results are representative for at least three independent assays (n = 15–20 zebrafish larvae per one experiment). |
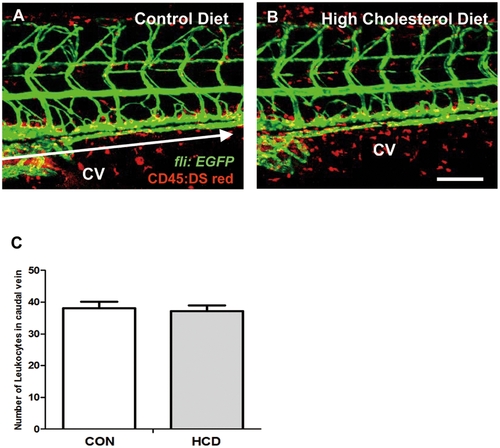
Vascular leukocytes accumulation in HCD fed zebrafish. zebrafish larvae were fed a normal (control) diet (A) or a 4% cholesterol-enriched (HCD) (B) for 10 days. Images of the caudal vasculature in live larvae show leukocytes accumulation in blood vessel or around tissues deposits in zebrafish larvae. Scale bar = 80 μm. The number of leukocytes in caudal vein (yellow) between each edge of arrow were counted in each a control diet and HCD group (each group n = 9) (C). CV, caudal vein. |
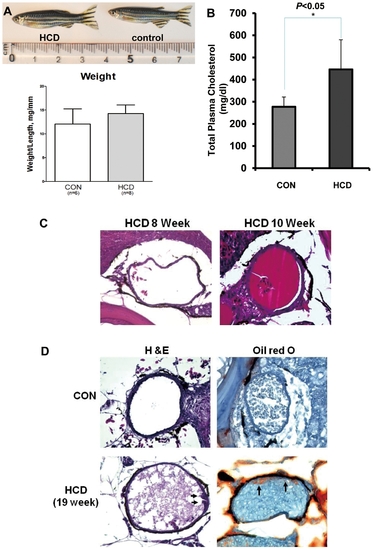
HCD-induced hypercholesterolemia and vascular lipid accumulation in adult zebrafish. Five-week-old zebrafish were fed a 4% cholesterol-enriched (HCD) or a normal diet (control) diet for 8, 10, and 19 weeks. A. Male fish (confirmed by dissection) fed a HCD or a control diet. The ratio of body weight to length (body mass index) (n = 6–8 in each group, males; no statistically significant differences). B. Total plasma cholesterol levels of zebrafish fed a HCD or a control diet after feeding 19 weeks (n = 10 in each group, both males and females). C and D. Dorsal aortas of HCD-fed zebrafish or control diet. HCD-fed zebrafish for 8 to 10 weeks; (C) H & E staining. (D) Fatty streak lesion formed in the doral aorta of 19 week HCD-fed zebrafish. Arrows show the lipid accumulation by Oil-Red O staining. |
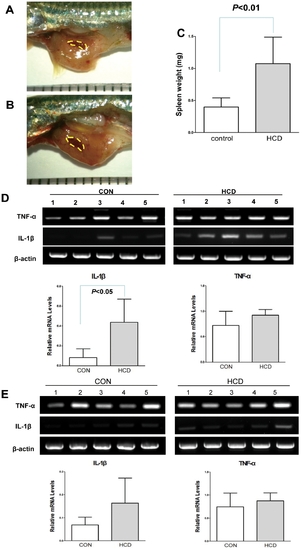
The expression levels of IL-1β and TNF-α in spleen from zebrafish fed HCD for 19 weeks. A and B, The size of spleen of zebrafish fed a normal diet (A, control) and a high-cholesterol diet (B, HCD) for 19 weeks. Each scale = 1 mm. C. Spleen weight of zebrafish fed a HCD or a control diet after 19 week feeding; Weight formula = (a×b2)/2, a = long length, b = short length. (n = 10 in each group, both males and females). D. The expression levels of IL-1β and TNF-α of the spleen from zebrafish fed a HCD or a control diet for 19 weeks. E. The expression levels of IL-1β and TNF-α of the liver from zebrafish fed a HCD or a control diet for 19 weeks. Semi-quantification PCR was performed for IL-1β and TNF-α. Results are representative for at least three independent assays (n = 5 in each group, males). |