
|
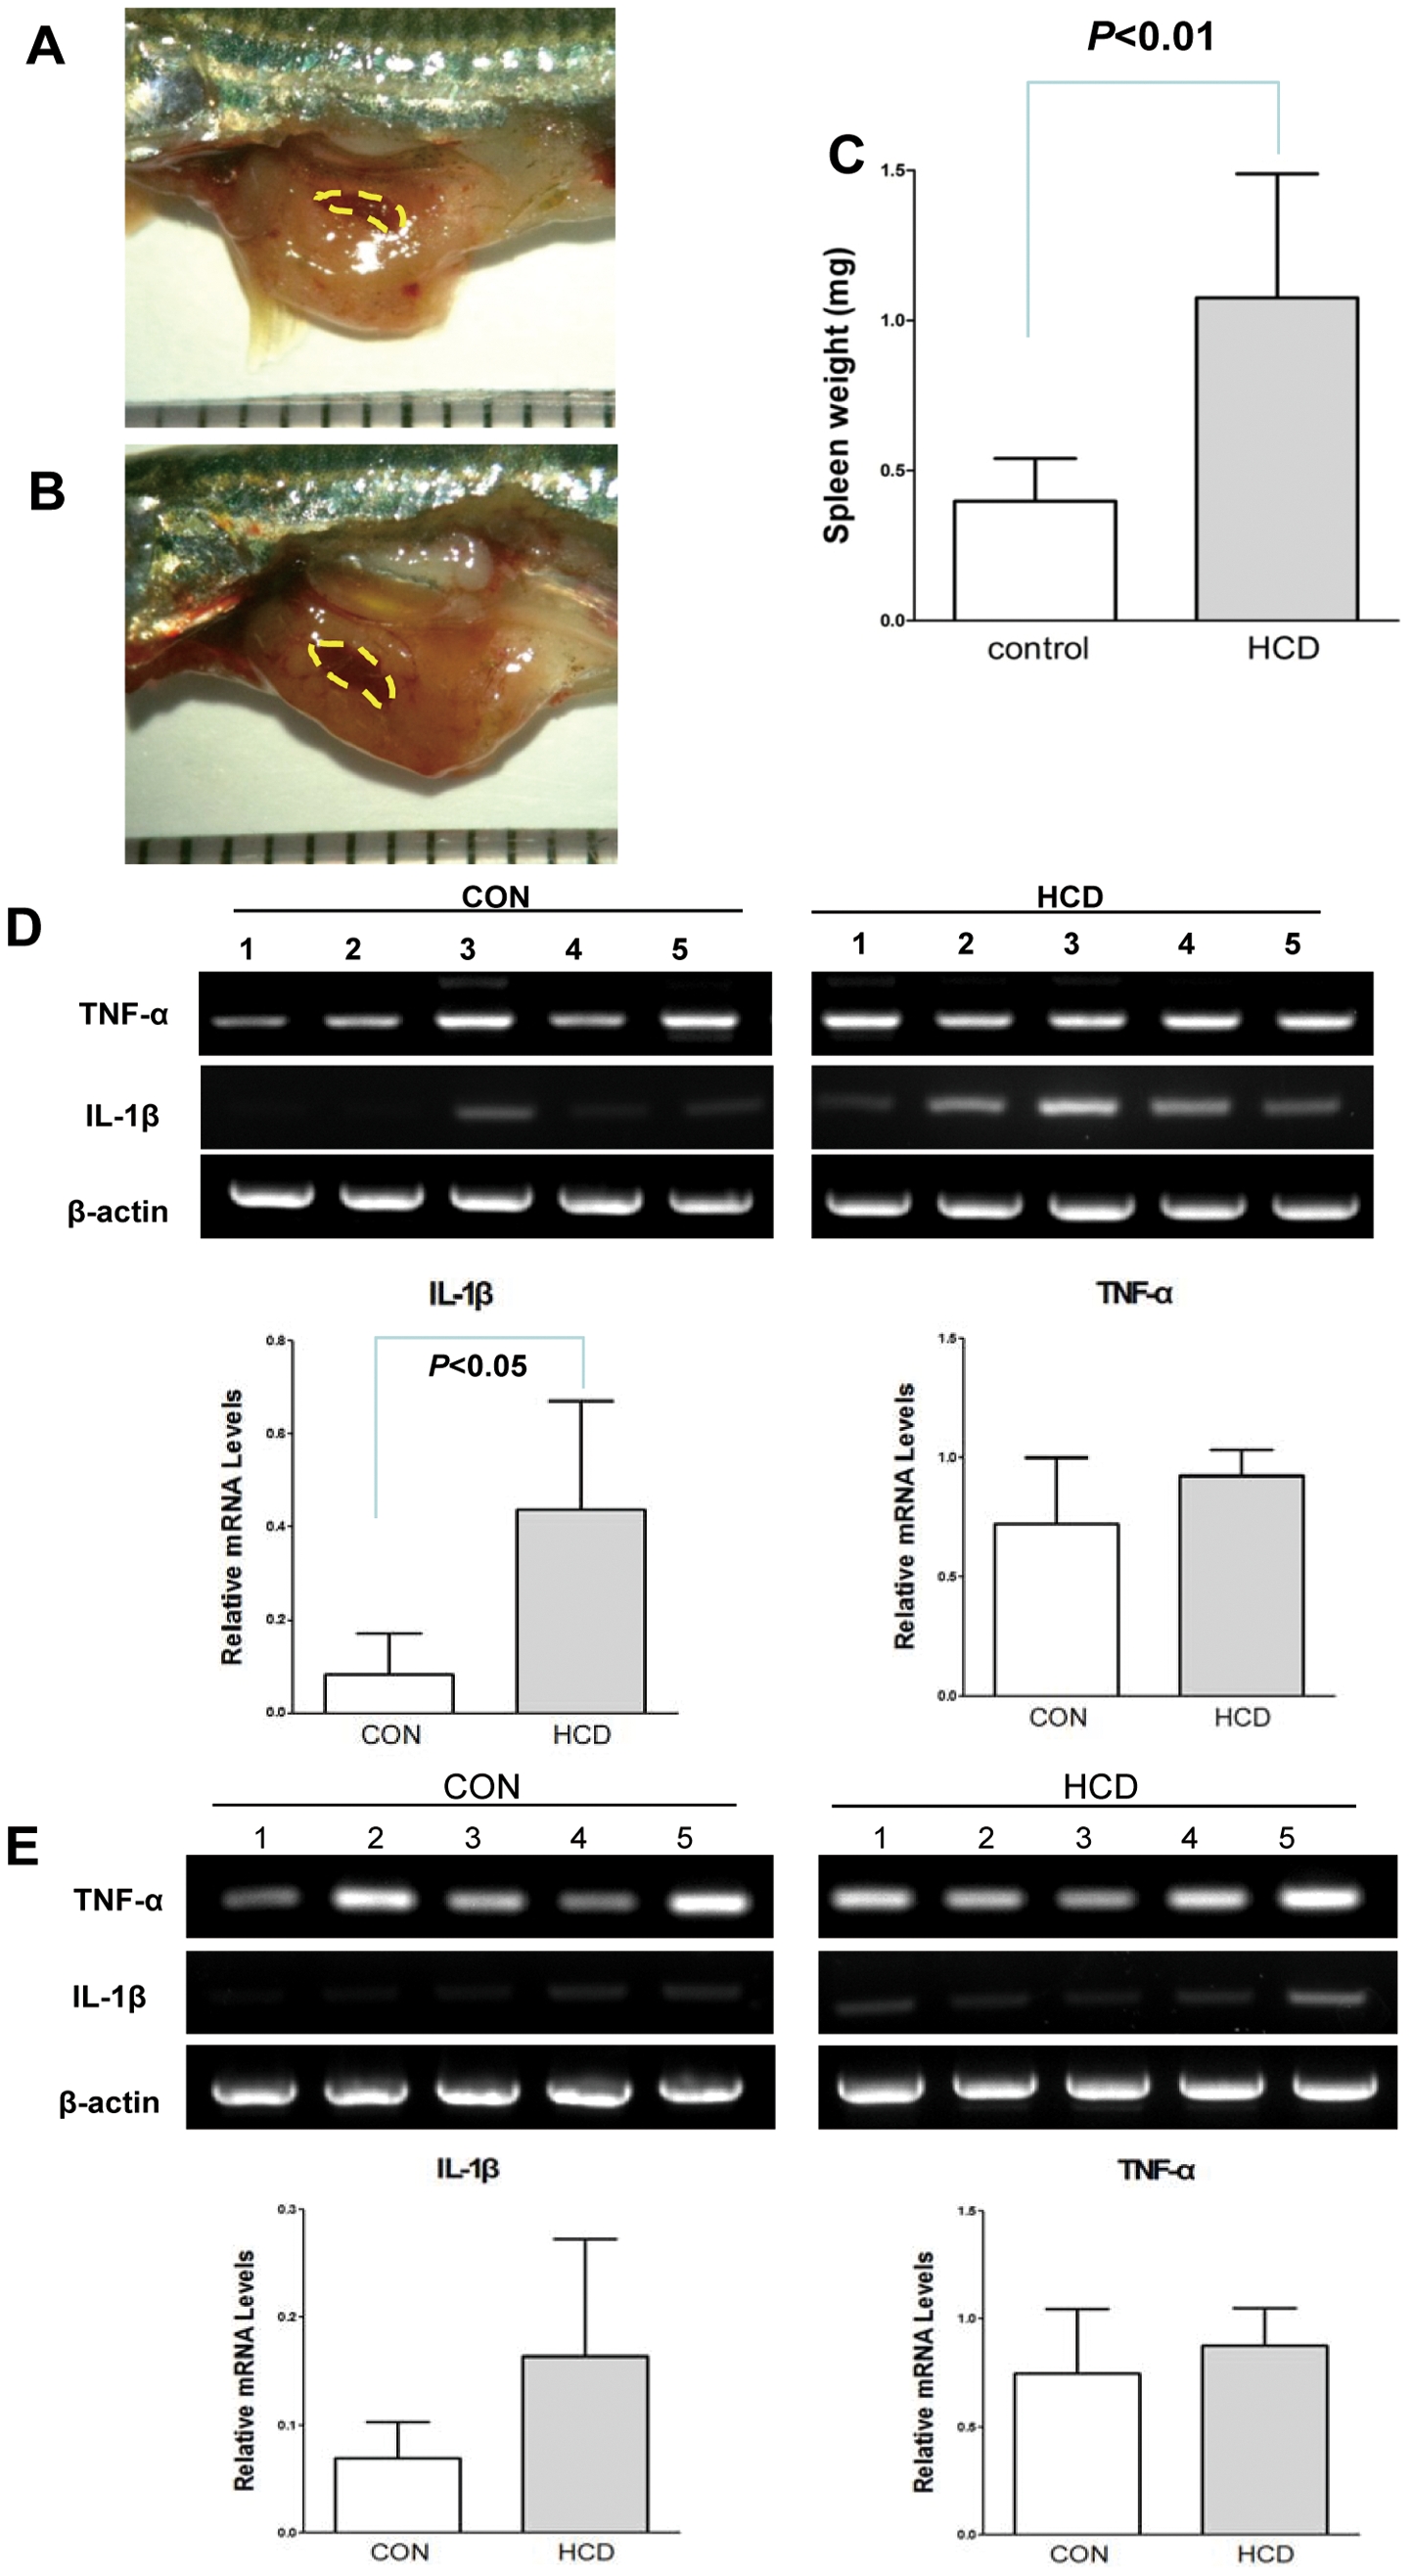
Fig. 4
The expression levels of IL-1β and TNF-α in spleen from zebrafish fed HCD for 19 weeks.
A and B, The size of spleen of zebrafish fed a normal diet (A, control) and a high-cholesterol diet (B, HCD) for 19 weeks. Each scale = 1 mm. C. Spleen weight of zebrafish fed a HCD or a control diet after 19 week feeding; Weight formula = (a×b2)/2, a = long length, b = short length. (n = 10 in each group, both males and females). D. The expression levels of IL-1β and TNF-α of the spleen from zebrafish fed a HCD or a control diet for 19 weeks. E. The expression levels of IL-1β and TNF-α of the liver from zebrafish fed a HCD or a control diet for 19 weeks. Semi-quantification PCR was performed for IL-1β and TNF-α. Results are representative for at least three independent assays (n = 5 in each group, males).