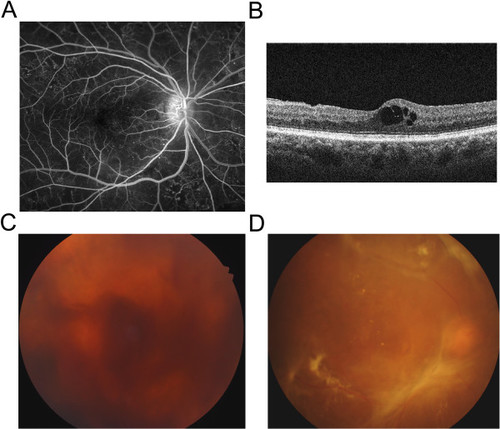
Pathologic changes in patients with DR. (A) Microaneurysm is one of the characteristic findings in patients with NPDR, demonstrated by tiny hyperfluorescent spots in the fluorescein angiography. (B) Disruption in neurovascular units and breakdown of inner BRB leads to ME in DR patients. Optical coherence tomography demonstrates cystoid ME. (C) In PDR patients, VH can occur from fragile new vessels. (D) Fibrovascular proliferation from retinal neovascularization forms diffuse tractional membrane, resulting in TRD.
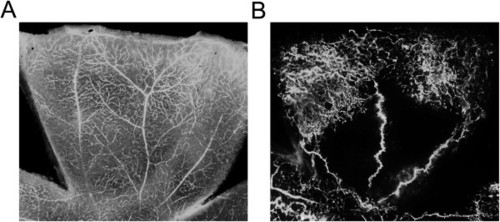
Animal models of DR demonstrating increased vascular permeability (A) and retinal neovascularization (B). (A) Intraperitoneal injection of streptozocin to mice leads to hyperglycemia in 2 ~ 3 days and increased vascular permeability ensues in a week. Flat-mounted retina after the intravenous injection of FITC-dextran evidences diffuse leakage of retinal vessels. (B) Exposure to hyperoxia from P7 to P12 results in retinal neovascularization, which starts at P14 and peaks at P17. Flat-mounted retina after the intravenous injection of FITC-dextran demonstrates central ischemic retina with small vascular tufts at the junction between vascularized and avascular retina.
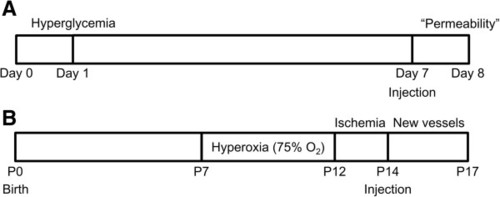
Schematic protocols of the streptozocin-induced diabetic mice model (A) and the OIR mice model (B). (A) One or 2 days after the intraperitoneal injection of streptozocin to mice, the level of serum glucose reaches above 350 mg/dl. One week later, vascular permeability can be identified with the leakage of tracer molecules such as FITC-dextran. At day 7 from streptozocin injection, candidate drugs are injected intravitreally and the therapeutic effects of them can be analyzed 24 hours after the injection (day 8). (B) Newborn mice are exposed to hyperoxia from P7 to P12 and then returned to room air. Intravitreal injection of candidate drugs are performed at P14 and the therapeutic effects of them can be analyzed at P17.
Acknowledgments
This image is the copyrighted work of the attributed author or publisher, and
ZFIN has permission only to display this image to its users.
Additional permissions should be obtained from the applicable author or publisher of the image.
Full text @ J. Biomed. Sci.
Your Input Welcome
Thank you for submitting comments. Your input has been emailed to ZFIN curators who may contact you if
additional information is required.
Oops. Something went wrong. Please try again later.