|
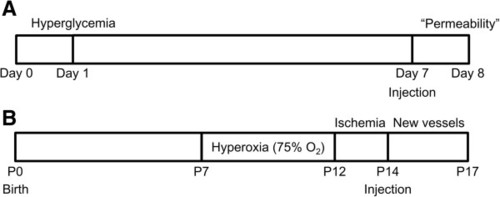
Schematic protocols of the streptozocin-induced diabetic mice model (A) and the OIR mice model (B). (A) One or 2 days after the intraperitoneal injection of streptozocin to mice, the level of serum glucose reaches above 350 mg/dl. One week later, vascular permeability can be identified with the leakage of tracer molecules such as FITC-dextran. At day 7 from streptozocin injection, candidate drugs are injected intravitreally and the therapeutic effects of them can be analyzed 24 hours after the injection (day 8). (B) Newborn mice are exposed to hyperoxia from P7 to P12 and then returned to room air. Intravitreal injection of candidate drugs are performed at P14 and the therapeutic effects of them can be analyzed at P17.
|