
- Title
-
Fixation/permeabilization: New alternative procedure for immunofluorescence and mRNA in situ hybridization of vertebrate and invertebrate embryos
- Authors
- Fernandez, J., and Fuentes, R.
- Source
- Full text @ Dev. Dyn.
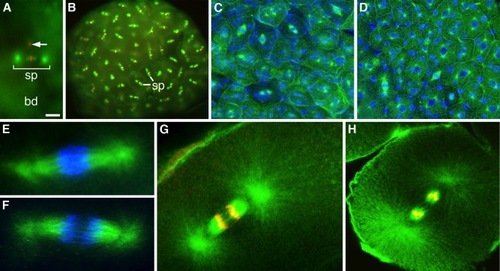
Immunofluorescence staining of zebrafish whole-mounted embryos. A: Double stained (microtubules green, chromosomes red) metaphase first cleavage spindle (sp). The arrow points to the DNA left by the extruded second pole cell. bd, blastodisc [Form-Acet-Peg]. B: Similarly stained blastula with numerous methaphase mitotic spindles (sp) [Form-Acet]. C,D: Confocal images of advanced blastulae showing asynchronously dividing blastodermal cells (microtubules, green; nuclei, blue) prepared with our method [Form-Acet] and stained for β-tubulin (C) or according to Solnica-Krezel and Driever (1994) (D). E,F: High magnification double-stained (microtubules, green; chromosomes, blue) metaphase (E) and anaphase (F) mitotic spindles stained for tyrosinated tubulin [Form-Acet-Peg]. G,H: Confocal images (microtubules, green; chromosomes, red) of anaphase mitotic spindles stained for tyrosinated (G) and α-tubulin (H). The latter image was deconvolved. Notice the successful staining of peripheral and astral microtubules [nForm-Acet-DMSO-Tx]. Scale bar = 30 μm in A, 55 μm in B, 25 μm in C,D, 3 μm in E,F, 10 μm in G,H. |
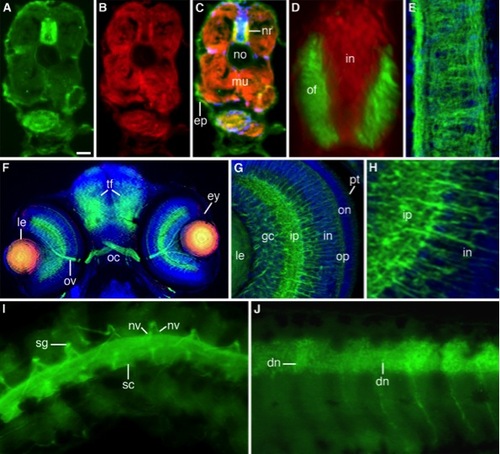
Immunofluorescent staining of freeze-sectioned 3-day-old (A–H) and whole-mounted 6-day-old (I,J) zebrafish larvae. A–C: Microtubule-stained (A), actin-stained (B), and merged image (C) of a triple stained (DAPI) larva. Microtubules and actin filaments co-distribute in the outer sector of the neural rod (nr) and developing musculature (mu). ep, epidermis; no, empty notochord [Form-Acet]. D: Double-stained (microtubules, green; nuclei, red) merge image of the neural rod showing its inner nuclear (in) and outer fibrillar (of) sectors [Form-Acet]. E: Confocal deconvolved double-stained image (microtubules green, nuclei blue) of a longitudinally sectioned neural rod [Form-Acet]. F: Triple-stained (microtubules, green; β-catenin, red; nuclei, blue) merged image of a coronal section along the head of a larva showing the eye (ey), optic nerve (ov), optic chiasm (oc), and tectal fiber tracts (tf). The central lens (le) cells express β-catenin and microtubules [Form-Acet]. G: Confocal deconvolved merge image of a double-stained (microtubules, green; nuclei, blue) eye showing the retina layers: pt, photoreceptors; on/op, outer nuclear and plexiform layers; in/ip, inner nuclear and plexiform layers; gc, ganglion cell layer; le, lens [Form-Acet]. H: Sector of the same retina showing the inner nuclear (in) and plexiform (ip) layers. I: Spinal cord (sc), nerve roots (nv), and sensory ganglia (sg) stained for microtubules. J: Optical section of a similarly stained spinal cord with developing neurons (dn) [Form-Acet]. Scale bar = 25 μm in A–C, 10 μm in D,E, 35 μm in F, 15 μm in G, 6 μm in H, 25 μm in I,J. |
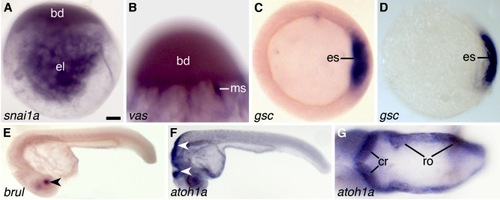
mRNA in situ hybridization of whole-mounted zebrafish zygotes (A,B), gastrulae (C,D), and 1-day-old (E–G) larvae [Form-Acet]. A: Distribution of snai1a mRNA in the blastodisc (bd) and endoplasmic lacunae (el). B: Distribution of vas mRNA in meridional streamers (ms) and base of the blastodisc (bd). C: Expression of gsc mRNA in cells of the embryonic shield (es). D: Control showing the expression of gsc mRNA in cells of the embryonic shield (es) using the Thisse and Thisse (2008) protocol. Differences between the quality of the in situ hybridizations shown in C and D are confirmed when we compare our results with those obtained by others with a similar method in the same embryonic material (see Shao et al., 2012). E: Expression of brul mRNA in the lens (arrowhead). F: Expression of atoh1a mRNA in the hindbrain (arrowheads). G: Dorsal view of the hindbrain showing expression of atoh1a in the developing cerebellum (cr) and rhombencephalon (ro). Scale bar = 90 μm in A,C,D, 50 μm in B, 200 μm in E, 140 μm in F, 35 μm in G. |