
- Title
-
Migration of cardiomyocytes is essential for heart regeneration in zebrafish
- Authors
- Itou, J., Oishi, I., Kawakami, H., Glass, T.J., Richter, J., Johnson, A., Lund, T.C., and Kawakami, Y.
- Source
- Full text @ Development
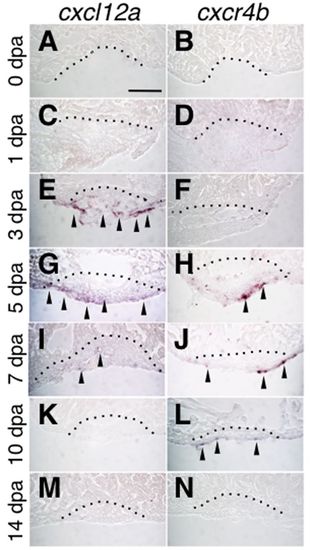
Expression of cxcl12a and cxcr4b during heart regeneration. (A-N) In situ hybridization for cxcl12a (A,C,E,G,I,K,M) and cxcr4b (B,D,F,H,J,L,N) in the regenerating heart. Time points at 0 (A,B), 1 (C,D), 3 (E,F), 5 (G,H), 7 (I,J), 10 (K,L) and 14 (M,N) dpa are shown. An evident expression of cxcl12a was detected at 3 dpa to 7 dpa (E,G,I). Strong expression of cxcr4b was detected at 5 dpa (H) and persisted until 10 dpa (L). Scale bar: 50 μm. |

Cxcr4 is present on CMs. (A,B) Confocal images of Cxcr4 (green) and Mef2 (magenta) double staining of control heart at 7 dpa. The Cxcr4 signal was detected at the cell surface of nuclear Mef2-positive cells in the regenerating area (arrowheads in B). B shows a higher magnification image of the boxed area in A. The dotted line indicates the amputation plane. (C-E) Confocal images of Cxcr4 (C) and cmlc2a-EGFP signal, detected by anti-GFP antibody (D), and a merged image (E). The arrowheads point to cells positive for both Cxcr4 and cmlc2a-EGFP signals. (F-H) Confocal images of Cxcr4 (F) and fli1-EGFP signal, detected by anti-GFP antibody (G), and a merged image (H). Scale bars: 50 μm. |
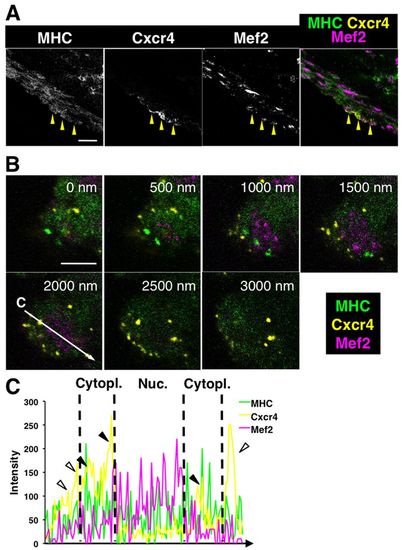
Confocal imaging of Cxcr4-expressing cardiomyocytes. (A) Confocal images of MHC, Cxcr4 and Mef2 at 7 dpa. The yellow arrowheads point to Cxcr4-positive cells. (B) Images of a Cxcr4-expressing CM at 500 nm distance along the z-axis. Mef2 represents the nucleus (magenta), MHC represents cytoplasm (green) and Cxcr4 is shown in yellow. The numbers in the upper area of each panel indicate positions along the z-axis. (C) Optical section of a Cxcr4-expressing cell. High levels of Mef2 signal and MHC signal define a nucleus and cytoplasm, respectively. The open arrowheads and solid arrowheads indicate Cxcr4 in membrane and cytoplasm, respectively. The vertical axis represents fluorescence intensity. Scale bars: 100 μm in A; 10 μm in B. |

Cxcr4 function is required for heart regeneration. (A-F′) MHC (brown) and hematoxylin (purple) staining of control (A,A′,C,C′,E,E′) and CXCR4-antagonist-treated (B,B′,D,D′,F,F′) heart at 14 dpa (A-B′), 30 dpa (C-D′) and 60 dpa (E-F′). (G-L′) MHC and hematoxylin staining of wild-type (G,G′,I,I′,K,K′) and cxcr4b-/- (H,H′,J,J′,L,L′) heart at 14 dpa (G-H′), 30 dpa (I-J′) and 60 dpa (K-L′). A′-L′ show close up of the boxed area in A-L, respectively. The arrowheads in A′, B′, G′ and H′ point to the MHC signal in the regenerating area. The black and red arrows in C′-F′ and I′-L′ point to the presence and absence of a sealed muscle wall, respectively. Dotted lines in A, B, G and H indicate the amputation planes. Scale bars: 50 μm. |

Blocking Cxcr4 function causes mis-localization of proliferating CMs. (A-B′) Pcna (green) and Mef2 (magenta) staining of control (A,A2) and CXCR4-antagonist-treated (B,B′) hearts at 14 dpa. The yellow arrowheads point to proliferating CMs seen as white signal. A ′ and B2 show close up of the boxed area in A and B. For simplicity, not all proliferating CMs are labeled. (C) Quantitation of the number of proliferating CMs in control and CXCR4-antagonist-treated hearts at 7, 14, 21 and 30 dpa. The vertical axis represents the number of proliferating CMs per section. A section that represents the largest injury area at the center of the injury site of each heart was examined (n=5). P-values at each time point are shown. (D) Quantitation of the ratio of proliferating CMs in the injury site compared with the number of entire proliferating CMs in control and CXCR4 antagonist-treated hearts at 14 dpa. The same samples examined in C were used. (E-F′) EdU (green) and cmlc2a-mCherry (magenta) signal of control (E,E′) and CXCR4 antagonist-treated (F,F′) hearts at 13 dpa. The yellow arrowheads point to proliferating CMs seen as white signal. For simplicity, not all proliferating CMs are labeled. E′ and F′ show close up of the boxed area in E and F. (G) Quantitation of the number of EdU/cmlc2a-mCherry double-positive cells in control and CXCR4 antagonist-treated hearts at 13 dpa. Vertical axis represents the number of proliferating CMs per section. A section that represents the largest injury area at the center of the injury site of each heart was examined (n=5). (H) Quantitation of the ratio of EdU-positive CMs in the injury site compared with the number of entire EdU-positive CMs in control and CXCR4-antagonist-treated hearts at 13 dpa. The same samples examined in G were used. For D, G and H, P-values by Student′s t-test are shown. Dotted lines in A, B, E and F indicate the amputation planes. Scale bars: 50 μm. |
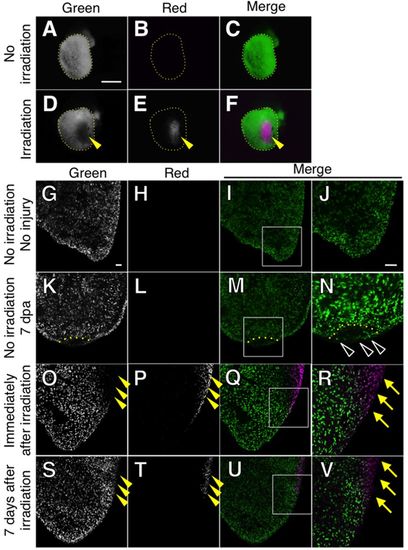
CM labeling by the Kaede photoconversion shows no CM migration in non-injured hearts. (A-F) Localized photoconversion of the adult cmlc2a-Kaede heart. Green (A,D), red (B,E) and merged images (C,F) of whole mount samples without irradiation (A-C) and immediately after irradiation (D-F) are shown. Without irradiation, hearts show only green fluorescence (A-C). After localized irradiation, the fluorescence was converted to red in the irradiated area (E,F). (G-V) Green (G,K,O,S), red (H,L,P,T) and merged images (I,M,Q,U) of sectioned samples are shown. J, N, R and V show higher magnification images of the boxed area in I, M, Q and U, respectively. (G-J) No red fluorescence was detected without irradiation and injury. (K-N) No red fluorescence was detected at 7 dpa without irradiation. The dotted line indicates the amputation plane. Some green cells are detected in the regenerating area (N, open arrowheads). (O-R) Images immediately after irradiation without injury. The green signal in the irradiated area was lost (arrowheads, O) and red signal in the same area was detected (arrowheads, P). The merged images show boundary of green-red signal (Q,R). The yellow arrows in R point to the photoconverted CMs. (S-V) Images 7 days after irradiation without injury. Red signal was detected in the irradiated area (arrowheads, T), and green signal was detected in the irradiated area by newly synthesized Kaede (arrowheads, S). The yellow arrows in V point to the photoconverted CMs. Scale bars: 500 μm in A; 50 μm in G and J. |

Cxcr4 function is required for CM migration during heart regeneration. (A) Experimental strategy to assay CM migration during heart regeneration. After localized photoconversion of the cmlc2a-Kaede heart, hearts are exposed by enlarging the pericardiac window, and the ventricular apex is amputated. At the desired time, labeled CMs are examined by imaging analysis. (B-O) Green signal represents non-irradiated Kaede and newly synthesized Kaede after irradiation and red signal represents photoconverted Kaede. C, E, I, M, G, K and O show higher magnification images of boxed area in B, D, H, L, F, J and N, respectively. (B,C) Immediately after photoconversion and amputation, green signal was lost at the irradiated site (B, arrowheads), where red signal was detected (C, arrows). Ventricular amputation was performed in the non-irradiated area. (D,E) At 7 dpa, red signals (photoconverted CMs, white arrowheads in E) and green signals (non-photoconverted CMs, open arrowheads in E) were detected in the injury site. (H-M) At 10 dpa (H,I) and 14 dpa (L,M), red signals and green signals were also detected in the injury site. (F-O) CMs were not detected in the injury site of the CXCR4-antagonist-treated heart. All photoconverted CMs stayed outside the injury site (yellow arrows in G,K,O) by blocking Cxcr4 function. (P) Quantitation of the migrated CMs 7, 10 and 14 days after photoconversion and amputation. The vertical axis represents the percentage of photoconverted CMs in the injury site compared with the number of entire photoconverted CMs. A section at the center of the injury site was examined from each heart. Dotted lines indicate the amputation planes. The yellow arrowheads in B, D and F point to the irradiated areas. The yellow arrows in C, E, G, I, M, K and O point to red signals outside the injury site. The open arrowheads and white arrowheads point to non-photoconverted CMs and photoconverted CMs, respectively, in the regenerating area. The asterisks in D, J and N indicate the valves between the atrium and ventricle. Scale bars: 50 μm. |

Normal neo-vascularization and activation of FGF signaling after blocking Cxcr4 function. (A-D) fli1-EGFP (green) and cmlc2a-mCherry (magenta) signal in the control (A,C) and CXCR4-antagonist-treated (B,D) heart at 7 dpa (A,B) and 14 dpa (C,D). Arrowheads point to neo-vascularization in the regenerating area, visualized by the fli1-EGFP signal. (E) Quantitation of neo-vascularization. The fli-EGFP positive area compared with the regenerating area was measured and by ImageJ software. A section at the center of the injury site of each heart was examined (n=3). (F-I) FGF signaling status, visualized by phospho ERK1/2 (pERK1/2) immunoreactivity (F,G) and expression of mkp3/dusp6 (H,I) at 14 dpa in control (F,H) and CXCR4 antagonist-treated (G,I) hearts. The arrowheads point to the pERK1/2 (F,G) and mkp3/dusp6 (H,I) signals. The dotted lines indicate the amputation planes. Scale bars: 50 μm. |
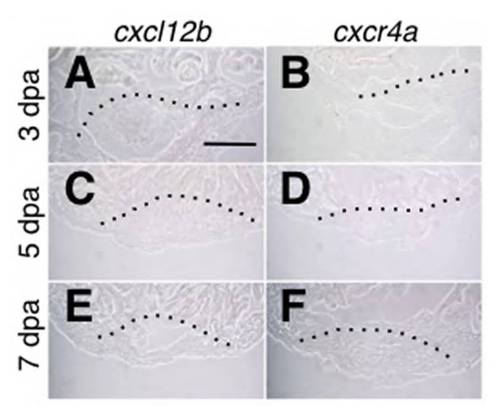
In situ hybridization of cxcl12b and cxcr4a in the regenerating heart. (A-F) In situ hybridization of cxcl12b (A,C,E) and cxcr4a (B,D,F) at 3 day (A,B), 5 day (C,D) and 7 day (E,F) post-amputation of the wildtype zebrafish heart. Expression of cxcl12b and cxcr4a were not detected. Scale bar: 50 μm. |

Anti-Mef2 antibody is specific to CMs. (A-C) Anti-Mef2 staining (A), anti-GFP staining and merged image (C) of sections from the cmlc2a-EGFP fish heart. Seven sections from three hearts were examined, and 3216 Mef2-positive cells were all positive for cmlc2a-EGFP signal. (D-F) Anti-Mef2 staining (D), anti-GFP staining (E) and merged image (F) of sections from the fli1-EGFP fish heart. Five sections from four hearts were examined, and 2268 Mef2-positive cells were all negative for fli1-EGFP signal. |

cxcl12a is expressed in the epicardial cells. (A,B) In situ hybridization for wt1b (A) and anti-DsRed2 staining (B) of adjacent sections from cxcl12a-DsRed2 reporter fish. (C,C′) A neighboring section, which is doubly stained for wt1b mRNA and anti-DsRed2. C′ shows higher magnification image of the boxed area in C. Arrowheads indicate signals where wt1b signals and Dsred2 signals overlap. Dotted line indicates the amputation plane. Shown are representative images from three independent experiments. (D-F) MHC staining (D), anti- DsRed2 staining (E) and merged image (F) from cxcl12a-DsRed2 reporter fish. Shown are representative images of multiple sections from two hearts. (G-I) fli1-EGFP reporter signal (G), cxcl12a-DsRed2 reporter signal (H) and merged image (I) from fli1-EGFP; cxcl12a-DsRed2 fish. Shown are representative images of multiple sections from two hearts. All images are from 3 dpa hearts. Scale bar: 50 μm. |

FC131 effectively blocks directed migration of primordial germ cells in zebrafish. (A-D) In situ hybridization of vasa to visualize PGCs in control (A,C) and FC131-treated (B,D) zebrafish embryos at 18 hours post-fertilization. FC131 treatment was carried out between 8 and 18 hours post-fertilization. Lateral views (A,B) and ventral views (C,D) of typical samples from more than 50 embryos are shown. Black arrowheads point to PGCs localized at the region where the gonad develops, and white arrowheads point to mis-localized PGCs. Scale bar: 250 μm. (E) Dose-dependent activity of FC131. FC131 at 0, 4, 20, 40 and 400 nM were tested for PCG migration. Vertical axis represents percentage of embryos that exhibited abnormal PCG migration. |
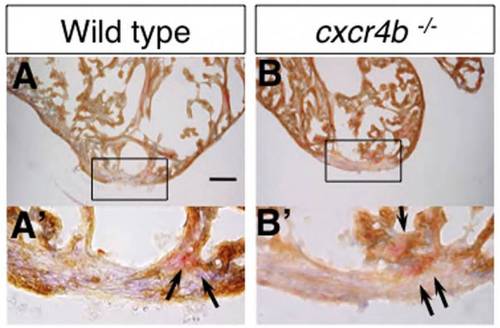
AFOG and MHC staining. (A-B′) MHC (brown) and acid fuchsin orange G (AFOG) staining of 14 dpa hearts of control fish (A,A′) and cxcr4b-/- fish (B,B′). Fibrin is visualized as red (arrows in A′ and B′). Small amount of fibrin is present similarly in control and cxcr4-/- fish at 14 dpa. |

CXCR4 antagonist treatment did not induce cell death. ( A-D ) Apoptotic cells detected using the TUNEL method (green, arrowhead) and CM marker Mef2 (magenta) were simultaneously detected. Control (A,C) and CXCR4 antagonist-treated heart (B,D) at 7 dpa (A,B) and 14 dpa (C,D) were analyzed. Shown are typical images from three hearts at each time point. Dotted lines indicate the amputation plane. TUNEL-positive CMs were barely detectable in both control and Cxcr4-inhibited heart. Scale bar: 50 μm. |

Photoconversion of the cmlc2a- Kaede heart. (A,B) Schematic representation of the cmlc2a- Kaede construct (A) and heart specific expression of green fluorescence of Kaede in 48 hours post fertilization cmlc2a- Kaede embryo (B). (C-H) Photoconversion of adult cmlc2a- Kaede heart. Bright field (C,F), green fluorescence (D,G) and red fluorescence (E,H) are shown, before (C-E) and after (F-H) photoconversion. Green fluorescence of Kaede (D) was converted to red fluorescence (H) by irradiation. Dotted line indicates the exposed heart. |

CXCR4 antagonist-treatment does not affect epicardial gene expression. (A-D) aldh1a2 mRNA expression (A,B) and fli1-EGFP reporter signal (C,D) in adjacent sections from the control (A,C) and CXCR4 antagonist-treated (B,D) hearts at 3 dpa. Arrows and arrowheads in A and B indicate epicardial expression of aldh1a2 and fli1-EGFP-positive endocardial aldh1a2 expression, respectively. (E,F) aldh1a2 expression in the control (E) and CXCR4 antagonist-treated (F) hearts at 7 dpa. Arrows indicate aldh1a2 expression. (G-J′) wt1b expression in the control (G,G′,I,I′) and CXCR4 antagonist-treated (H,H′,J,J′) hearts at 3 dpa (G-H′) and 7 dpa (I-J′). Arrowheads indicate expression of wt1b. G′,H′,I′,J′ show higher magnification of the boxed areas in G,H,I,J. Dotted lines indicate the amputation planes. Scale bar: 50 μm. (K) Quantitation of wt1b expressing epicardial tissue in the regenerating area. The ratio of the length of wt1b-expressing epicardial tissue (represented by blue lines in G,H,I,J), compared with the length of the surface of regenerating area was quantitated. n=3 at each time point. |