
|
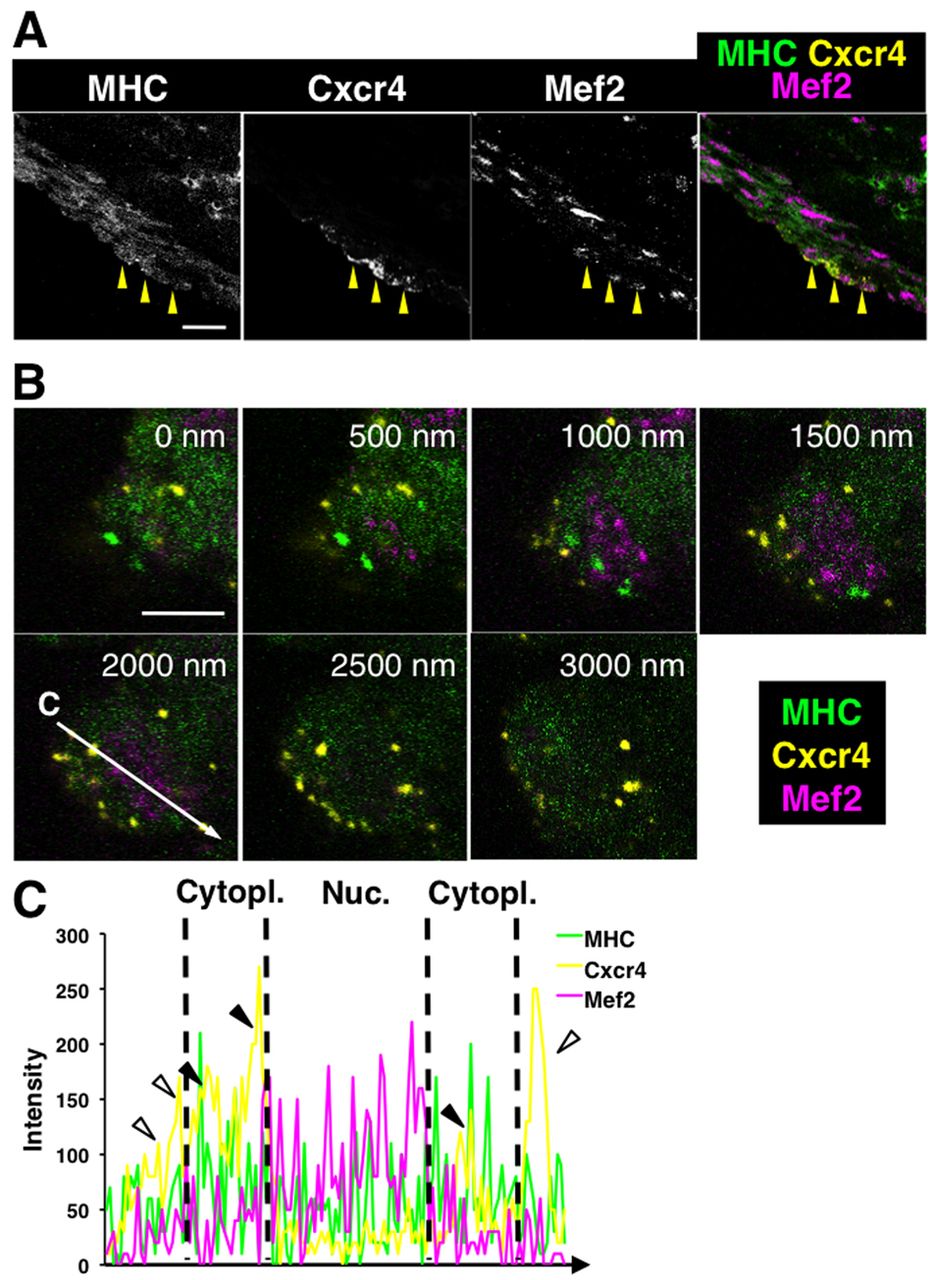
Fig. 3 Confocal imaging of Cxcr4-expressing cardiomyocytes. (A) Confocal images of MHC, Cxcr4 and Mef2 at 7 dpa. The yellow arrowheads point to Cxcr4-positive cells. (B) Images of a Cxcr4-expressing CM at 500 nm distance along the z-axis. Mef2 represents the nucleus (magenta), MHC represents cytoplasm (green) and Cxcr4 is shown in yellow. The numbers in the upper area of each panel indicate positions along the z-axis. (C) Optical section of a Cxcr4-expressing cell. High levels of Mef2 signal and MHC signal define a nucleus and cytoplasm, respectively. The open arrowheads and solid arrowheads indicate Cxcr4 in membrane and cytoplasm, respectively. The vertical axis represents fluorescence intensity. Scale bars: 100 μm in A; 10 μm in B.