
|
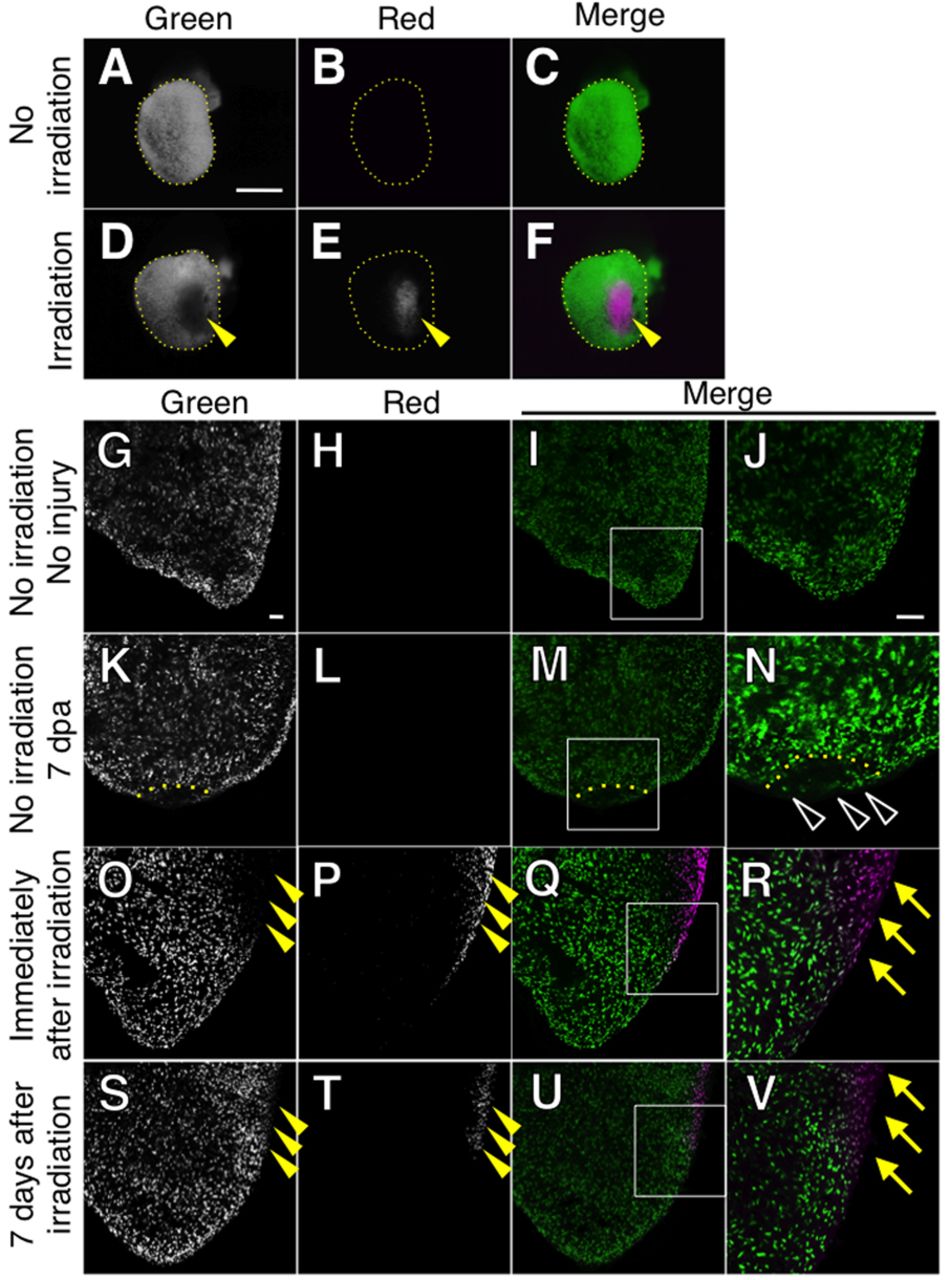
Fig. 6 CM labeling by the Kaede photoconversion shows no CM migration in non-injured hearts. (A-F) Localized photoconversion of the adult cmlc2a-Kaede heart. Green (A,D), red (B,E) and merged images (C,F) of whole mount samples without irradiation (A-C) and immediately after irradiation (D-F) are shown. Without irradiation, hearts show only green fluorescence (A-C). After localized irradiation, the fluorescence was converted to red in the irradiated area (E,F). (G-V) Green (G,K,O,S), red (H,L,P,T) and merged images (I,M,Q,U) of sectioned samples are shown. J, N, R and V show higher magnification images of the boxed area in I, M, Q and U, respectively. (G-J) No red fluorescence was detected without irradiation and injury. (K-N) No red fluorescence was detected at 7 dpa without irradiation. The dotted line indicates the amputation plane. Some green cells are detected in the regenerating area (N, open arrowheads). (O-R) Images immediately after irradiation without injury. The green signal in the irradiated area was lost (arrowheads, O) and red signal in the same area was detected (arrowheads, P). The merged images show boundary of green-red signal (Q,R). The yellow arrows in R point to the photoconverted CMs. (S-V) Images 7 days after irradiation without injury. Red signal was detected in the irradiated area (arrowheads, T), and green signal was detected in the irradiated area by newly synthesized Kaede (arrowheads, S). The yellow arrows in V point to the photoconverted CMs. Scale bars: 500 μm in A; 50 μm in G and J.