
|
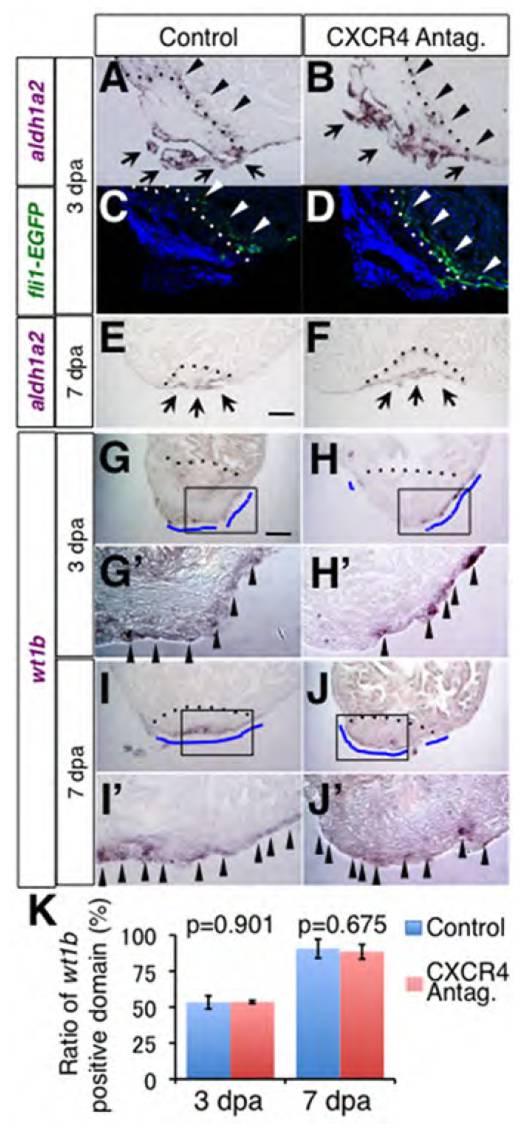
Fig. S9 CXCR4 antagonist-treatment does not affect epicardial gene expression. (A-D) aldh1a2 mRNA expression (A,B) and fli1-EGFP reporter signal (C,D) in adjacent sections from the control (A,C) and CXCR4 antagonist-treated (B,D) hearts at 3 dpa. Arrows and arrowheads in A and B indicate epicardial expression of aldh1a2 and fli1-EGFP-positive endocardial aldh1a2 expression, respectively. (E,F) aldh1a2 expression in the control (E) and CXCR4 antagonist-treated (F) hearts at 7 dpa. Arrows indicate aldh1a2 expression. (G-J′) wt1b expression in the control (G,G′,I,I′) and CXCR4 antagonist-treated (H,H′,J,J′) hearts at 3 dpa (G-H′) and 7 dpa (I-J′). Arrowheads indicate expression of wt1b. G′,H′,I′,J′ show higher magnification of the boxed areas in G,H,I,J. Dotted lines indicate the amputation planes. Scale bar: 50 μm. (K) Quantitation of wt1b expressing epicardial tissue in the regenerating area. The ratio of the length of wt1b-expressing epicardial tissue (represented by blue lines in G,H,I,J), compared with the length of the surface of regenerating area was quantitated. n=3 at each time point.