
- Title
-
Retinoic acid suppresses intestinal mucus production and exacerbates experimental enterocolitis
- Authors
- Oehlers, S.H., Flores, M.V., Hall, C.J., Crosier, K.E., and Crosier, P.S.
- Source
- Full text @ Dis. Model. Mech.

DSS exposure causes a distinct enterocolitis in zebrafish larvae when compared with TNBS exposure. (A) Whole-mount live imaging of control, DSS-and TNBS-exposed larvae. Red arrows indicate liver. (B) Comparison of recovered microbiota from homogenates of control, DSS- and TNBS-exposed larvae (n=7). (C) Characterization of neutrophilic inflammation in zebrafish larvae by: (i) live imaging of Tg(mpx:EGFP)i114 larvae; (ii) enumeration of neutrophils by FACS (n=5); and (iii) enumeration of intestinal neutrophils (n≥30 per group; three biological replicates). (D) Comparison of DAF-FM-DA staining in wild-type larvae treated as indicated. Red arrow indicates heart, blue arrow indicates cleithrum and yellow arrow indicates notochord. (E) Quantitative PCR analysis of pro-inflammatory cytokine and proliferating cell nuclear antigen gene expression in untreated and DSS-treated 6 dpf larvae (n=4). (F) Characterization of cellular proliferation in zebrafish larvae by: (i) live imaging of resazurin-stained larvae; (ii) quantification of fluorescence from live imaging (n=19); and (iii) manual counting of BrdU-positive cells in the gut and trunk (n=7). White arrowhead indicates otic vesicle and blue arrowhead indicates intestine in live images. Error bars indicate s.e.m.; ***P<0.0001, **P<0.01 and *P<0.05 as determined by ANOVA (B,C) or Student’s t-tests (E,F). Scale bars: 1 mm. EXPRESSION / LABELING:
|
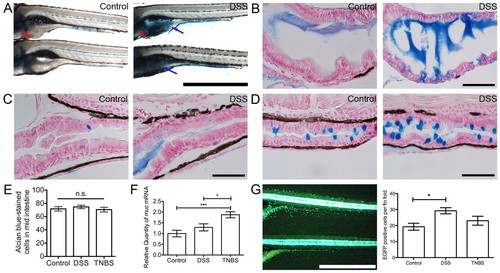
DSS exposure induces a mucosecretory phenotype in zebrafish larvae. (A) Whole-mount control and DSS-exposed larvae stained with alcian blue. Blue arrows indicate intestinal bulb staining, red arrows indicate cartilage staining. Scale bar: 1 mm. (B) Longitudinal sections of intestinal bulb from control and DSS-exposed larvae, stained with alcian blue. Scale bar: 50 μm. (C) Longitudinal sections of the anterior-mid intestinal junction at the posterior edge of the swim bladder from control and DSS-exposed larvae, stained with alcian blue. Scale bar: 50 μm. (D) Longitudinal sections of the mid-distal intestinal junction from control and DSS-exposed larvae, stained with alcian blue. Scale bar: 50 μm. (E) Enumeration of mid intestinal goblet cells by manual counting (n≥28 per group; two biological replicates). (F) Quantitative PCR analysis of muc expression in control, DSS- and TNBS-exposed larvae (n=4). (G; left) Live image of 6-dpf Tg(kita:GAL4, UAS:EGFP) larvae; fin fold was defined as epidermis immediately ventral to the intestine. Scale bar: 1 mm. (G; right) Enumeration of GFP-expressing skin goblet cells on the fin fold of individual larvae (n≥12 per group; two biological replicates). Error bars represent s.e.m.; *P<0.05, ***P<0.0001 as determined by ANOVA. EXPRESSION / LABELING:
|

The mucosecretory phenotype is microbiota-dependent but independent of neutrophilic inflammation. (A) Live imaging of neutrophil distribution in Tg(mpx:EGFP)i114 larvae co-treated with dexamethasone and DSS, and enumeration of intestinal neutrophils (n≥23 per group; two biological replicates). Scale bar: 1 mm. Error bars represent s.e.m.; ***P<0.0001 as determined by ANOVA. (B) Whole-mount larvae co-treated with dexamethasone and DSS, stained with alcian blue. Blue arrows indicate intestinal bulb staining; red arrows indicate cartilage staining. Scale bar: 1 mm. (C) Longitudinal sections of intestinal bulb from larvae co-treated with a cocktail of broad-spectrum antibiotics and DSS, stained with alcian blue. Scale bar: 50 μm. EXPRESSION / LABELING:
|
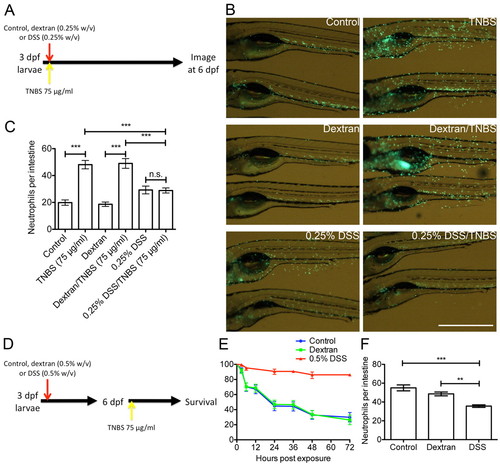
DSS-induced mucus secretion protects against further chemical-induced enterocolitis. (A) Schematic describing the experimental procedure analyzed in panels B and C. (B) Live imaging of neutrophil distribution in Tg(mpx:EGFP)i114 larvae co-treated as indicated. Scale bar: 1 mm. (C) Enumeration of intestinal neutrophils (n≥22 per group; two biological replicates). Error bars indicate s.e.m.; ***P<0.0001 as determined by ANOVA. (D) Schematic describing the experimental procedure reported in panels E and F. (E) Survival analysis of larvae treated as indicated from 3 dpf and exposed to 75 μg/ml TNBS from 6 dpf (n≥10 per group; six biological replicates). Error bars indicate 95% confidence interval. DSS vs control, DSS vs dextran: P<0.0001 as determined by log-rank test. (F) Enumeration of intestinal neutrophils in larvae exposed to 75 μg/ml TNBS from 6 dpf and assayed at 24 hours post-TNBS exposure (n≥12 per group; three biological replicates). Error bars indicate s.e.m.; ***P<0.0001, **P<0.01 as determined by ANOVA. EXPRESSION / LABELING:
|
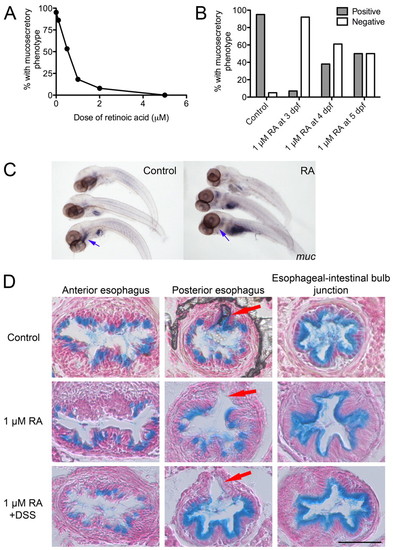
Retinoic acid suppresses the DSS-induced mucosecretory phenotype. (A) Dose-response curve of the percentage of DSS-exposed larvae positive for the mucosecretory phenotype after the administration of a range of doses of RA (n≥20 per group; two biological replicates). (B) Proportion of DSS-exposed larvae positive or negative for the mucosecretory phenotype at 6 dpf after administration of RA at the day indicated. Fisher’s exact test P-values vs untreated controls: 3 dpf<0.0001, 4 dpf=0.0002, 5 dpf=0.0011; n≥20 per group, two biological replicates. (C) Whole-mount in situ hybridization detection of muc expression in the esophagus in control and RA-treated larvae. Blue arrows indicate the location of the esophagus. (D) Alcian-blue-stained esophageal sections of larvae treated with 1 μM RA and exposed to DSS. Arrows indicate the pneumatic duct. Scale bar: 50 μm. EXPRESSION / LABELING:
|
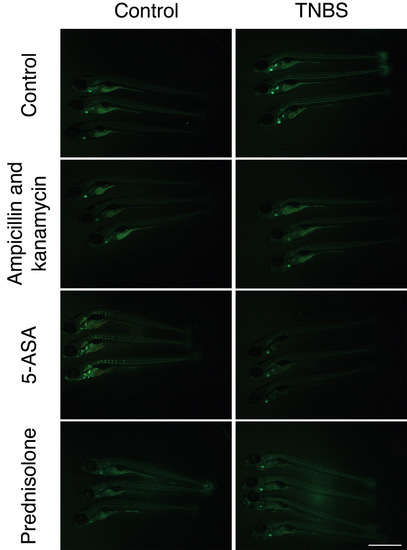
DAF-FM-DA staining can be used to monitor inflammation in the TNBS-induced enterocolitis model. Representative images of larvae treated as indicated and stained with DAF-FM-DA for nitric oxide detection. Scale bar represents 1 mm. |

Exposure to DSS does not cause overt changes to intestinal epithelial cell morphology. Transverse sections of esophagus from control and DSS-exposed larvae, stained with alcian blue. Scale bars indicate 50 μm. |

The kita promoter does not mark lysozyme C-expressing cells in zebrafish larvae. Confocal microscopy images of 6 dpf Tg(kita:GAL4, UAS:EGFP, lyzC:DsRednz50) larvae. A representative control specimen is shown on the left and a representative TNBS-exposed specimen is shown on the right. Images are centered on the posterior edge of the swim bladder. |

Retinoic acid-induced suppression of the mucosecretory is dose-dependent. Images of larvae treated as indicated with increasing doses of RA and stained with alcian blue. Scale bar indicates 1 mm. |
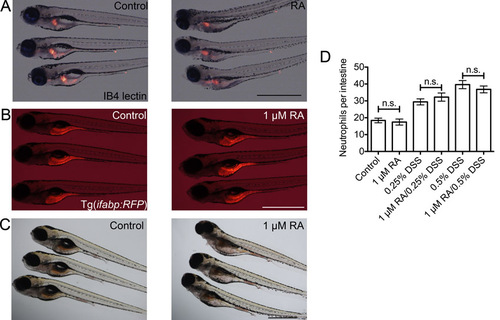
Doses of exogenous retinoic acid used in this study do not overtly affect intestinal patterning. (A) Representative images of whole mount IB4 lectin staining of the oesophageal-intestinal bulb junction in control and 1 μM RA-treated larvae. (B) Comparison of RFP expression in Tg(ifabp:RFP)as200 control and 1 μM RA-treated larvae. (C) Comparison of neutral red endocytosis by mid-intestinal epithelium in control and 1 μM RA-treated larvae. (D) Enumeration of intestinal neutrophils in larvae co-treated with 1 μM RA and DSS from 3 dpf (n≥30, two biological replicates). Error bars indicate S.E.M., P values determined by ANOVA. All scale bars indicate 1 mm. |

Methodology for determining intestinal neutrophil numbers. Live images of Tg(mpx:EGFP)i114 control and DSS-exposed larvae. Red outline demarcates the boundary of intestine used to enumerate intestinal neutrophils. Scale bar indicates 1 mm. |