
- Title
-
Host genotype-specific therapies can optimize the inflammatory response to mycobacterial infections
- Authors
- Tobin, D.M., Roca, F.J., Oh, S.F., McFarland, R., Vickery, T.W., Ray, J.P., Ko, D.C., Zou, Y., Bang, N.D., Chau, T.T., Vary, J.C., Hawn, T.R., Dunstan, S.J., Farrar, J.J., Thwaites, G.E., King, M.C., Serhan, C.N., and Ramakrishnan, L.
- Source
- Full text @ Cell
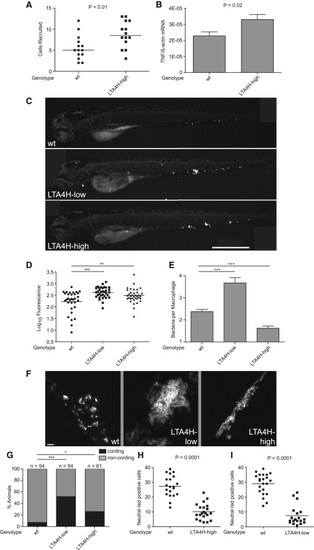
Extremes of LTA4H Expression Drive Hypersusceptibility in Zebrafish (A) Median number of macrophages recruited to the hindbrain ventricle of wild-type and LTA4H-high siblings 4 hr after injection of 150-200 M. marinum into this space at 30 hpf. p = 0.01 (Student′s unpaired t test). Representative of two independent experiments. (B) TNF mRNA levels (mean ± SEM of three independent experiments) for control and LTA4H-high siblings 1 dpi with 150-200 M. marinum. p = 0.02 by Student′s unpaired t test. (C) Fluorescence images of representative wild-type, LTA4H-low and LTA4H-high larvae 3 dpi with 90-100 M. marinum. (D) Bacterial burden of all larvae from (C) by fluorescence pixel counts (FPC). **p < 0.01; ***p < 0.001. (one-way ANOVA with Tukey′s post hoc test; all other comparisons not significant). Representative of > 7 independent experiments measuring differences in bacterial burden of the three genotypes. (E) Mean (±SEM) number of bacteria per infected macrophage in 11 wild-type larvae, 8 LTA4H-low larvae and 13 LTA4H-high larvae, 40 hpi with 150-200 erp mutant M. marinum. ***p < 0.001 (one way ANOVA with Dunnett′s post hoc test). Representative of two independent experiments. (F) Fluorescence images showing discrete bacterial clumps indicative of macrophage residence in wild-type versus corded extracellular bacteria in their LTA4H-low and LTA4H-high siblings at 3 dpi with 150-200 M. marinum. (G) Percentage of animals in (F) with cording among wild-type, LTA4H-low and LTA4H-high siblings 4 dpi after infection with 90-100 M. marinum. *p < 0.05; ***p < 0.001 (Fisher′s exact test comparing LTA4H-low and LTA4H-high to wild-type). (H) Quantitation of neutral red positive cells 4 dpi after infection with approximately 100 M. marinum in sibling controls and LTA4H-high animals and (I) sibling controls and LTA4H-low animals. See also Figure S2 and Movie S1, Movie S2, and Movie S3. |
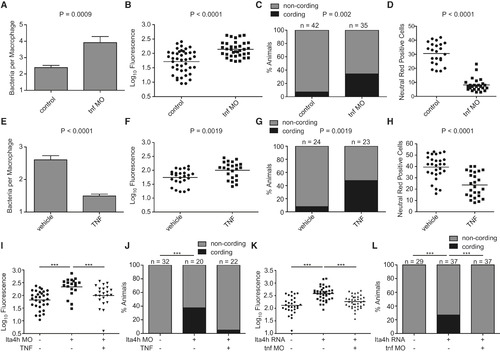
Modulation of TNF Levels Results in Genotype-Specific Rescue of LTA4H-Mediated Hypersusceptibility (A) Mean (±SEM) number of bacteria per infected macrophage 40-44 hpi with 150-200 erp mutant M. marinum of wild-type or TNF morphant (MO) siblings. (B) FPC in control or tnf morphant siblings 3 dpi with 90-100 M. marinum. (C) Quantitation of frequency of bacterial cording of the animals in (B). (D) Quantitation of neutral red positive cells 4 dpi after infection with 100 M. marinum in sibling controls or tnf morphants. (E) Mean (±SEM) number of bacteria per infected macrophage at 40-44 hpi in wild-type animals with or without injection of 0.5 ng rTNF 12 hr after infection with 150-200 erp mutant M. marinum. (F) FPC in control or rTNF injected siblings 3 dpi with 90-100 M. marinum. (G) Quantitation of frequency of bacterial cording of the animals in (F). (H) Quantitation of neutral red positive cells at 4 dpi after infection with 90-100 M. marinum in sibling controls or rTNF injected animals. (I) FPC in wild-type or lta4h morphant siblings 3 dpi with 90-100 M. marinum per animal after injection of 0.5 ng rTNF at 12 hpi. (J) Bacterial cording frequency of the animals in (I). (K) FPC in wild-type animals, LTA4H-high siblings, and LTA4H-high plus TNF morphant animals, at 3 dpi with 90-100 M. marinum. (L) Quantitation of frequency of bacterial cording in the animals in (K). Statistical comparisons in panels (I) and (K) by one-way ANOVA with Tukey′s post hoc test; in panels (C),(G),(J) and (L) by Fisher′s exact test; (A),(B),(D),(E),(F),(H) by Student′s unpaired t test. For all panels p < 0.05; p < 0.01; p < 0.001, all other comparisons not significant. See also Figure S3. |
Reprinted from Cell, 148(3), Tobin, D.M., Roca, F.J., Oh, S.F., McFarland, R., Vickery, T.W., Ray, J.P., Ko, D.C., Zou, Y., Bang, N.D., Chau, T.T., Vary, J.C., Hawn, T.R., Dunstan, S.J., Farrar, J.J., Thwaites, G.E., King, M.C., Serhan, C.N., and Ramakrishnan, L., Host genotype-specific therapies can optimize the inflammatory response to mycobacterial infections, 434-446, Copyright (2012) with permission from Elsevier. Full text @ Cell