
- Title
-
Spatiotemporal expression of the creatine metabolism related genes agat, gamt and ct1 during zebrafish embryogenesis
- Authors
- Wang, L., Zhang, Y., Shao, M., and Zhang, H.
- Source
- Full text @ Int. J. Dev. Biol.

Expression of agat in zebrafish embryos. Left side views for the whole mount, except where noted, with anterior up and dorsal to the right. (A) 50%-epiboly stage, showing that agat mRNA was first detected in the YSL. (B) 70%-epiboly stage, showing increased expression in the YSL. (C) 8-somite stage (13 h), showing agat expression in mature somites and the YSL. (D) Cross section of (C) through the line d. (E) 25-somite stage (21.5 h), showing strong expression in the YSL and weak expression in the mature somites. (F) Cross section of (E) through the line f. (G) Long-pec stage (48 h), left side view, with dorsal side up and anterior to the left. Expression of agat disappeared in the somites, but persisted in the YSL and appeared in the liver. (H) Cross section of (G) through the line h, showing strong expression in the liver and the YSL. LV, liver; SO, somite; YSL, yolk syncytial layer. Scale bar: 250 μm. EXPRESSION / LABELING:
|
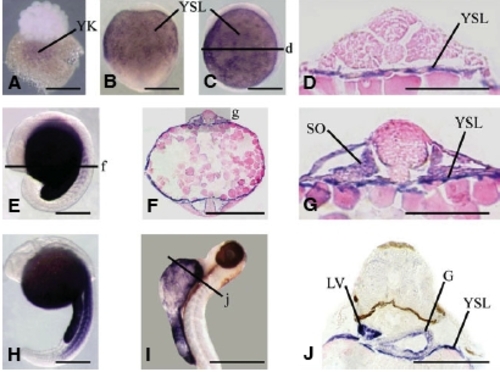
Expression of gamt in zebrafish embryos. Left side views for the whole mount, except where noted, with anterior up and dorsal to the right. (A) Early cleavage stage, side view. Weak expression was found in the center of the yolk. (B) Bud stage (10 h), ventral view. Expression of gamt appeared in the YSL. (C) 8-somite stage (13 h), showing gamt expression in the YSL. (D) Cross section of (C) through the line d. (E) 15-somite stage (16.5 h); gamt is expressed in the YSL and the mature somites. (F) Cross section of (E) through the line f. (G) Enlargement of the gray shadow area g in (F), showing gamt expression in the YSL and the somites. (H) 25-somite stage (21.5 h), showing increased expression in the somites. (I) Long-pec stage (48 h). (J) Cross section of (I) through the line j. Staining of gamt disappeared in the somites, but persisted in the YSL and appeared in the liver and the gut. G, gut; LV, liver; SO, somite; YK, yolk; YSL, yolk syncytial layer. Scale bar: 80 μm for (G) and 250μm for others. |

Expression of ct1 in zebrafish embryos. Left side views for the whole mount, except where noted, with anterior up and dorsal to the right. (A) 4-cell stage, animal pole view. (B) 70%-epiboly stage. (C) 90%- epiboly stage. (D) 8-somite stage (13 h). ct1 mRNA was distributed ubiquitously in the embryonic tissues in (AD) while no signal was found in the YSL. (E)15-somite stage (16.5 h). (F) Ventral view of (E). (G) Dorsal view of (E). The expression was restricted in the somites, the optic vesicles and the CNS. (H) Prim-5 stage (24 h). (I) Dorsal view of (H). The expression of ct1 mRNA persisted in both the newly formed and the matrue somites. (J) Cross section of (H) through the line j, showing the expression in the somites. (K) Prim-15 stage (30 h), showing ct1 mRNA in the somites. (L) Long-pec stage (48 h), showing the expression of ct1 in the foregut. (M) Cross section of (L) through the line m, showing ct1 expression in the epithelial cells of the foregut. CNS, central nervous system; G, gut; OV, optic vesicle; SO, somite. Scale bar: 80 μm for (J) and (M), 250μm for others. |