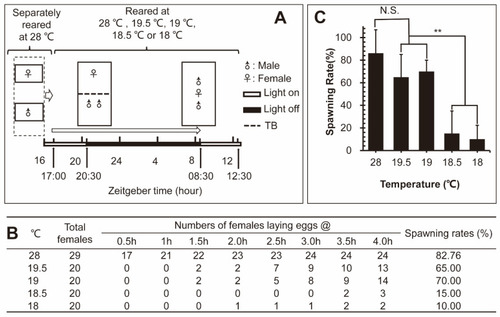
The fecundity of the zebrafish at different temperatures. (A) The schematic diagram for the fecundity of the zebrafish experimental process. (TB: transparent baffle). (B) The number of spawning zebrafish increased over time and spawning rates of female zebrafish at different temperatures. (C) Comparison of female spawning rates at different temperatures. (** p < 0.01; N.S.: no significance).

The workflow of RNA−seq data analysis. (A) Main steps of RNA−seq data analysis in the study. (B) Statistics for mapping of reads in four groups. The sample names used the experimental temperatures. Temperatures at 19.5 °C and 19 °C are egg-spawning groups and temperatures at 18.5 °C and 18 °C are non-spawning groups. (C) Validation of RNA−seq data with quantitative RT−PCR (qPCR). Log2 fold changes of RNA−seq data for gene expression were plotted against those of qPCR data. The reference straight line in black indicates the linear relationship between the results of RNA−seq and qPCR. (p < 0.00001, correlation coefficient = 0.8114). (D) Fold changes and standard error of mean (SEM) for 17 selected genes of RNA−seq were validated with qPCR.

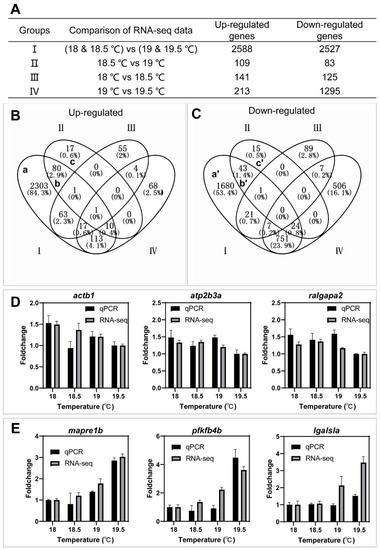
Identification of key genes associated with the spawning of females using Venn diagram. (A) The number of differentially expressed genes between groups of different temperatures (fold change ≥ 1.5 and p-value ≤ 0.05). (B) Up-regulated genes in different Venn groups to identify key genes between non-spawning and egg-spawning groups I and II (a, b, and c). (C) Down-regulated genes in different Venn groups to identify key genes between non-spawning and egg-spawning groups I and II (a’, b’ and c’). (D) Validation of RNA-seq data by qPCR for three genes from the group of up-regulated genes in groups I and II (a, b, and c). (E) Validation of RNA-seq data by qPCR for three genes from the group of down-regulated genes in groups I and II (a’, b’ and c’).

Hub signaling pathways from KEGG enrichment analysis of up- and down-regulated key genes. (A) Dot plot of KEGG signaling pathways for up-regulated key genes. (B) Dot plot of KEGG signaling pathways of down-regulated key genes. (C) Network of top 10 hub pathways for up-regulated key genes. (D) Network of top 10 hub pathways for down-regulated key genes. Nodes represent pathways and edges represent Jaccard similarity coefficients. Node color and size stand for the enrichment p-value and the number of genes in the pathway, respectively.

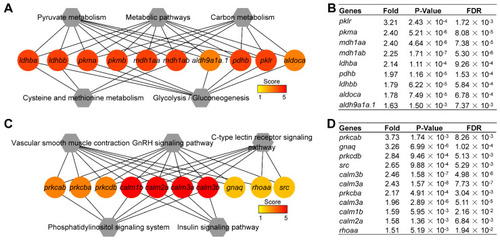
Hub genes within the top five hub pathways. (A) Network of 10 hub genes mapped to top five hub pathways enriched from up-regulated key genes. (B) The fold change of up-regulated hub genes in group I. FDR: false discovery rate (C) Network of 10 hub genes mapped to top five hub pathways enriched from down-regulated key genes. (D) The fold change of down-regulated hub genes in group I. Round stands for genes; hexagon represents pathways; edge means the gene mapped to the pathway in (A,C).

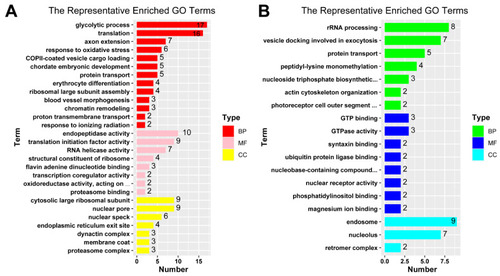
Bar plots for representative terms of GO enrichment analysis. GO terms redundancy were reduced by REVIGO tool to give a representative subset of terms for up-regulated key genes (A) and down-regulated key genes (B). Representative GO terms of different aspects of biology are shown in different colors, BP: biological process; MF: molecular function; CC: cellular component.

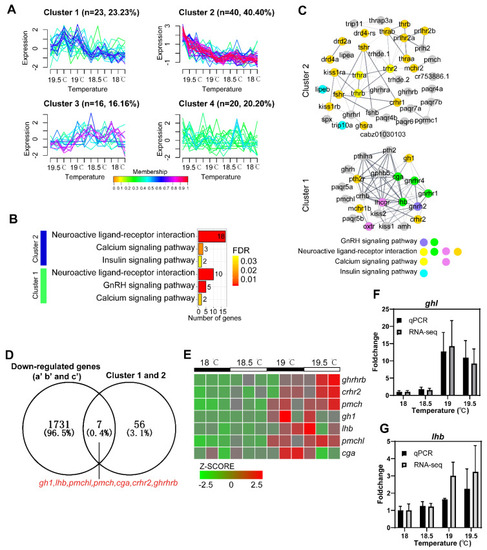
Details of hormone−related genes detected in the female zebrafish brains by RNA−seq. (A) Clustering analysis of hormone−related genes. (B) Bar plot of pathway enrichment analysis of genes in cluster 1 and cluster 2. False discovery rate (FDR) < 0.05. (C) Protein−protein interaction network of genes in cluster 1 and cluster 2. Nodes represent genes; edges stand for relationship of different genes; different color means different signaling pathways as shown at the bottom. (D) Venn diagram was used to identify down-regulated key genes that were shared in the group of down-regulated genes (a’, b’ and c’) and cluster 1 and 2. (E) Heat map of seven down-regulated key genes, presented as the normalization of TPM (z−score). (F,G) Fold changes and SEM of RNA−seq and qPCR for two representative down-regulated key genes gh1 and lhb.

Acknowledgments
This image is the copyrighted work of the attributed author or publisher, and ZFIN has permission only to display this image to its users. Additional permissions should be obtained from the applicable author or publisher of the image. Full text @ Int. J. Mol. Sci.