FIGURE

Figure 7

ID
ZDB-FIG-220801-129
Publication
Ge et al., 2022 - Transcriptomic Profiling Revealed Signaling Pathways Associated with the Spawning of Female Zebrafish under Cold Stress
Other Figures
All Figure Page
Back to All Figure Page
Figure 7

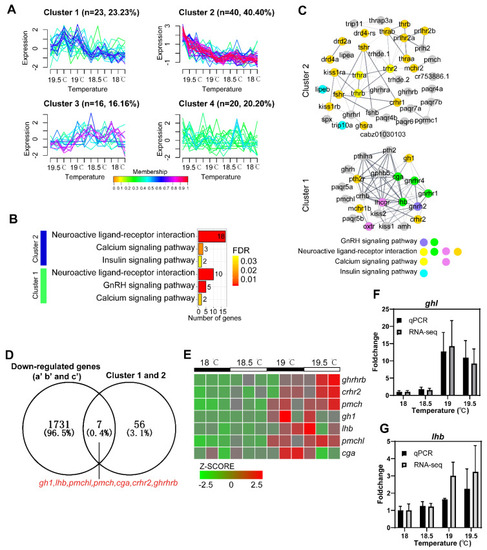
Details of hormone−related genes detected in the female zebrafish brains by RNA−seq. (A) Clustering analysis of hormone−related genes. (B) Bar plot of pathway enrichment analysis of genes in cluster 1 and cluster 2. False discovery rate (FDR) < 0.05. (C) Protein−protein interaction network of genes in cluster 1 and cluster 2. Nodes represent genes; edges stand for relationship of different genes; different color means different signaling pathways as shown at the bottom. (D) Venn diagram was used to identify down-regulated key genes that were shared in the group of down-regulated genes (a’, b’ and c’) and cluster 1 and 2. (E) Heat map of seven down-regulated key genes, presented as the normalization of TPM (z−score). (F,G) Fold changes and SEM of RNA−seq and qPCR for two representative down-regulated key genes gh1 and lhb.

Expression Data

Expression Detail
Antibody Labeling
Phenotype Data

Phenotype Detail
Acknowledgments
This image is the copyrighted work of the attributed author or publisher, and ZFIN has permission only to display this image to its users. Additional permissions should be obtained from the applicable author or publisher of the image. Full text @ Int. J. Mol. Sci.