IMAGE

Figure 2

ID
ZDB-IMAGE-220801-125
Source
Figures for Ge et al., 2022
Image
Figure Caption

Figure 2

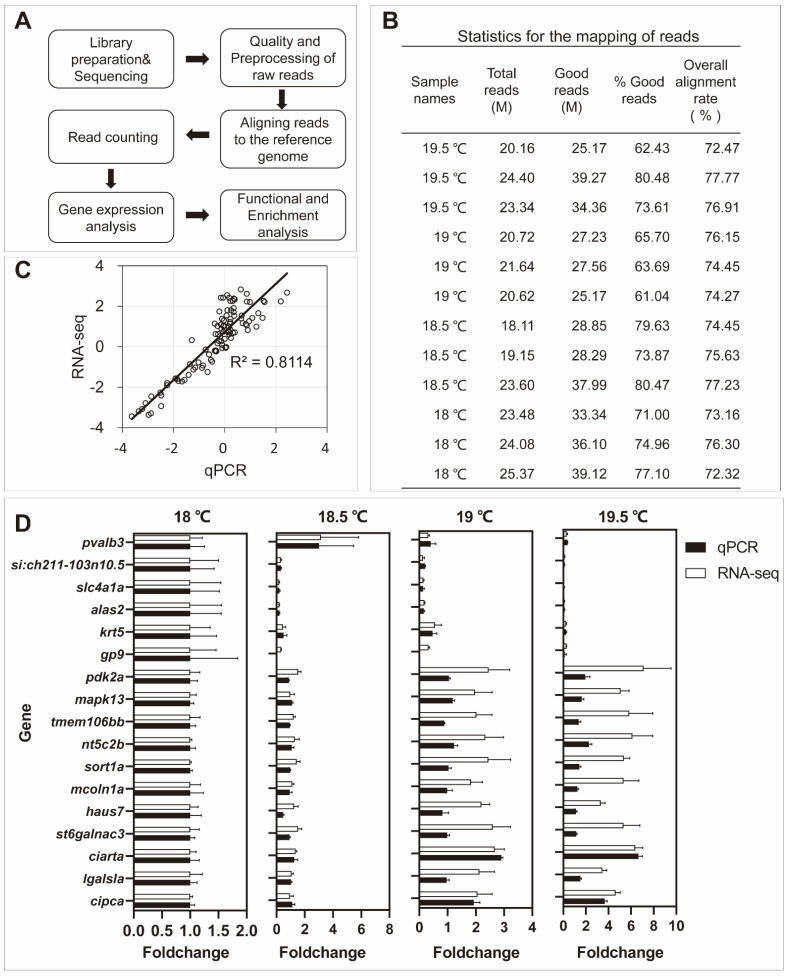
The workflow of RNA−seq data analysis. (A) Main steps of RNA−seq data analysis in the study. (B) Statistics for mapping of reads in four groups. The sample names used the experimental temperatures. Temperatures at 19.5 °C and 19 °C are egg-spawning groups and temperatures at 18.5 °C and 18 °C are non-spawning groups. (C) Validation of RNA−seq data with quantitative RT−PCR (qPCR). Log2 fold changes of RNA−seq data for gene expression were plotted against those of qPCR data. The reference straight line in black indicates the linear relationship between the results of RNA−seq and qPCR. (p < 0.00001, correlation coefficient = 0.8114). (D) Fold changes and standard error of mean (SEM) for 17 selected genes of RNA−seq were validated with qPCR.

Acknowledgments
This image is the copyrighted work of the attributed author or publisher, and ZFIN has permission only to display this image to its users. Additional permissions should be obtained from the applicable author or publisher of the image. Full text @ Int. J. Mol. Sci.