
FIGURE
Figure 6
- ID
- ZDB-FIG-220801-128
- Publication
- Ge et al., 2022 - Transcriptomic Profiling Revealed Signaling Pathways Associated with the Spawning of Female Zebrafish under Cold Stress
- Other Figures
- All Figure Page
- Back to All Figure Page
Figure 6
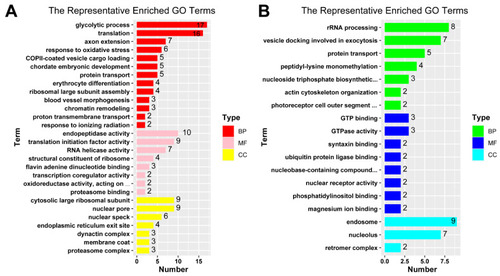
Bar plots for representative terms of GO enrichment analysis. GO terms redundancy were reduced by REVIGO tool to give a representative subset of terms for up-regulated key genes ( |
Expression Data
Expression Detail
Antibody Labeling
Phenotype Data
Phenotype Detail
Acknowledgments
This image is the copyrighted work of the attributed author or publisher, and
ZFIN has permission only to display this image to its users.
Additional permissions should be obtained from the applicable author or publisher of the image.
Full text @ Int. J. Mol. Sci.