
- Title
-
Venous Thrombosis and Thrombocyte Activity in Zebrafish Models of Quantitative and Qualitative Fibrinogen Disorders
- Authors
- Fish, R.J., Freire, C., Di Sanza, C., Neerman-Arbez, M.
- Source
- Full text @ Int. J. Mol. Sci.
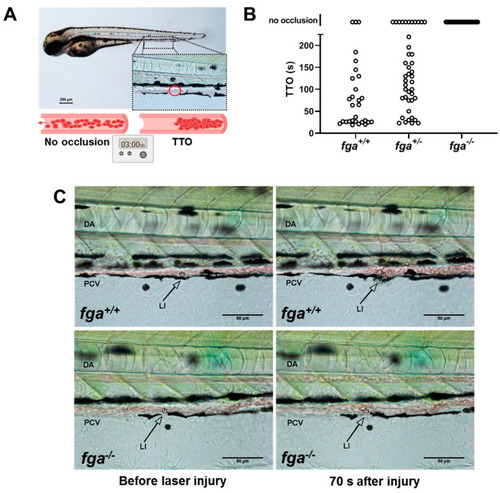
Laser-induced venous thrombosis in an afibrinogenemia model. (A) Diagram of time-to-occlusion (TTO) assay. The posterior caudal vein (PCV) is targeted for laser injury (region represented by the red circle) near the 5th somite distal to the cloaca and the time to PCV occlusion measured. A 3-min cut-off is used to determine no occlusion. (B) TTO in seconds (s) in 3 dpf fga+/+, fga+/? and fga?/? larvae. Each circle represents an individual larva. (C) Time lapse images of 3 dpf fga+/+ and fga?/? larvae before and after laser injury at the position marked (LI). DA is the dorsal aorta. PHENOTYPE:
|

Thrombocyte adhesion and aggregation in afibrinogenemic zebrafish. (A) Laser-induced vessel injury to measure thrombocyte binding and accumulation in 5 dpf Tg(itga2b:EGFP) embryos with fluorescent thrombocytes. The thrombocyte-associated green fluorescence accumulation after laser injury within a defined region was measured over time for individual larvae. Each line represents the mean fluorescence (+/? SEM) for each group. The number of larvae per group is indicated in brackets. (B) Images from fga+/+ and fga?/? larvae upon (0 s) and after laser injury, times as indicated. The dorsal aorta (DA), posterior cardinal vein (PCV) and site of laser injury (LI, arrow) are indicated. Green near the laser injury site (arrow head) indicates the laser flash (0 s) and the accumulation of green fluorescent thrombocytes at later time points. |
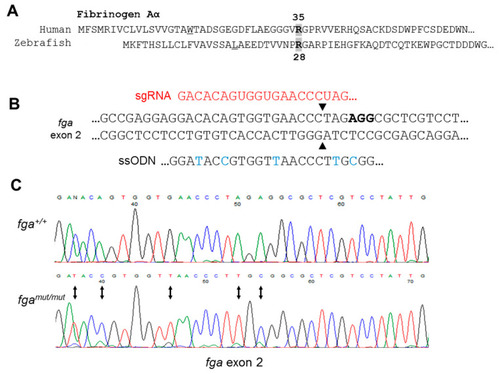
Genome editing of fga exon 2. (A) Aligned N-terminal region of human and zebrafish fibrinogen A? chains. A? R35 and A? R28 are indicated. (B) CRISPR/Cas9 strategy for fga exon 2 editing through homology directed repair (HDR). In red is part of the sgRNA targeting the edited region by complementarity, in bold is the PAM sequence. Part of the ssODN for HDR is shown to highlight edited nucleotides (blue), including codon usage changes and the Arg to Cys codon change. (C) Sanger sequencing to confirm genome edited sequence in genomic DNA from homozygous mutant fish (fgamut/mut), compared to wild-type (fga+/+). Changed nucleotides are highlighted with arrows. |

fga exon 2 skipping. (A) A scheme to highlight changes in fga exon 2 genomic DNA in red (gDNA) led to exon 2 skipping after transcription and splicing. A partial cDNA sequence to show the exon 1 to exon 3 splicing is shown. (B) Immunoblotting of plasma samples from fga+/+, fga+/?19?56, and fga?19?56/?19?56 fish with anti-ceruloplasmin and anti-fibrinogen A? chain antibodies. (C) Amino acid alignment of the predicted fibrinogen A? chains resulting from the human FGA IVS2+3insCAT mutation and the zebrafish fga?19?56 mRNA. The junction of exon 1- and exon 3-encoded amino acids are in bold and underlined for each chain. |

Laser-induced venous thrombosis in a hypodysfibrinogenemia model. (A) TTO for 3 dpf fga+/+, fga+/?19?56 and fga?19?56/?19?56 larvae. Each circle represents one larva. The number of larvae tested in each group is shown in brackets. (B,C) Time lapse images of fga+/+ and fga?19?56/?19?56 larvae upon (0 s) or 30 s after injury. The dorsal aorta (DA), posterior cardinal vein (PCV) and site of laser injury (LI) are indicated. An arrow marks the laser target. A red bracket in the right panel of B highlights the region of thrombus formation. PHENOTYPE:
|
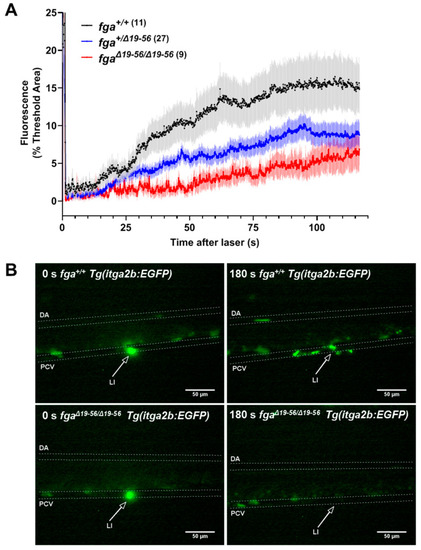
Thrombocyte adhesion and aggregation in a hypodysfibrinogenemia model. (A) Fluorescent thrombocyte binding and adhesion in 5 dpf Tg(itga2b:EGFP) embryos after laser injury of the PCV over time in fga+/+, fga+/?19?56 and fga?19?56/?19?56 genotypes. Each line represents the mean (+/?SEM) of thrombocyte fluorescence reaching a threshold fluorescence within a defined area. (B) Time lapse images of fga+/+ and fga?19?56/?19?56 larvae upon (0 s) and 180 s after laser injury. Fluorescence from the laser is seen at 0 s and where green fluorescent thrombocytes accumulate at 180 s. The dorsal aorta (DA), posterior cardinal vein (PCV) and site of laser injury (LI, arrows) are indicated. |

TTO measurements in fga morpholino knockdown embryos with transgenic expression of A?E, A?E R28C, or both, to model dysfibrinogenemia. (A) A scheme representing the experimental set-up. Early TU zebrafish embryos were injected with and without an fga mRNA-targeting morpholino (MO) in the absence or presence of Tol2 plasmids for expression of fibrinogen A?E, A?E R28C, A?E + A?E R28C or a half quantity of A?E (1/2 A?E). Tol2 transposase mRNA was also present within injection mixes (not shown). At 3 dpf the TTO assay was performed to measure venous thrombosis time. The MO inhibits endogenous fga mRNA splicing but cannot target the transgenically expressed A?E and A?E R28C mRNAs. (B) TTO data for each experimental group, each circle represents one larva (n = 19 to 22). PHENOTYPE:
|

Fluorescent thrombocyte binding and aggregation after PCV laser injury in fga?/? larvae with transgenic A?E or A?E R28C expression: a model of dysfibrinogenemia. (A) A scheme representing the experimental setup. Early Tg(itga2b:EGFP), fga?/? embryos were microinjected with Tol2 transgenesis plasmids for expression of fibrinogen A?E or A?E R28C, A?E + A?E R28C or a half quantity of A?E (A?E �). Tol2 transposase mRNA was also present in injection mixes (not shown). (B) Fluorescent thrombocyte binding and adhesion at 5 dpf were monitored for each experimental group over time after PCV laser injury. Each line represents the mean fluorescence (+/?SEM). The number of larvae per group is shown in brackets. PHENOTYPE:
|