
- Title
-
Endothelial TGF-β signaling instructs smooth muscle cell development in the cardiac outflow tract
- Authors
- Boezio, G.L., Bensimon-Brito, A., Piesker, J., Guenther, S., Helker, C.S., Stainier, D.Y.
- Source
- Full text @ Elife
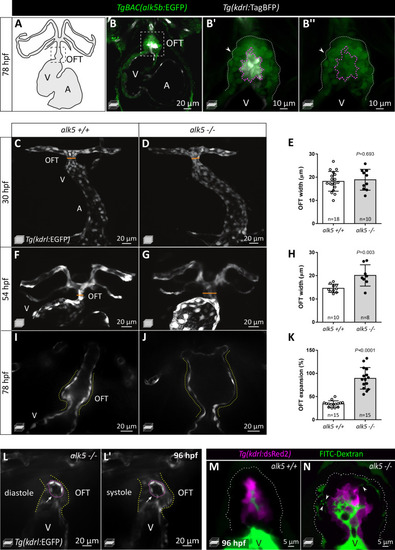
(A) Schematic of the zebrafish heart and connecting vessels at 78 hpf; ventral view; black, endothelium/endocardium. (B?B??) Confocal images showing TgBAC(alk5b:EGFP) expression (green) in the 78 hpf zebrafish heart. White, ECs; arrowheads, SMCs; boxed area shown in B? and B??; white dotted lines outline the OFT; magenta dotted lines outline ECs. (C?H) Confocal images (C, D, F, G) and quantification (E, H) of OFT width in alk5+/+ and alk5-/- embryos at 30 (C?E) and 54 (F?H) hpf. Orange line shows OFT width graphed in E and H. (I?K) Frames of confocal movies of beating hearts (I, J) and quantification of OFT expansion (K) at 78 hpf. For details about the quantifications, see Materials and methods ?Defining the landmarks of the OFT?. (L, L?) Frames of confocal movies of 96 hpf alk5-/- beating hearts during ventricular diastole (L) and systole (L?). Pink dotted lines outline ECs surrounding the rupture; arrows point to the site of EC rupture; yellow dotted lines outline the OFT. (M, N) Confocal images of 96 hpf alk5+/+ and alk5-/- OFTs showing the accumulation (arrowheads) of FITC-Dextran (green) between the SMCs in alk5-/- OFTs (7/11; alk5+/+ 0/10). Magenta, ECs; dotted lines outline the OFT. (C?G) Maximum intensity projections. (B, I?N) Single confocal planes. (E, H, K) Plot values represent mean � SD; p values from t-tests. A- atrium, V- ventricle. Scale bars: (B, C?L?) 20 ?m; (B?, B??) 10 ?m; (M, N) 5 ?m. See also Figure 1?figure supplement 1. EXPRESSION / LABELING:
|

( |
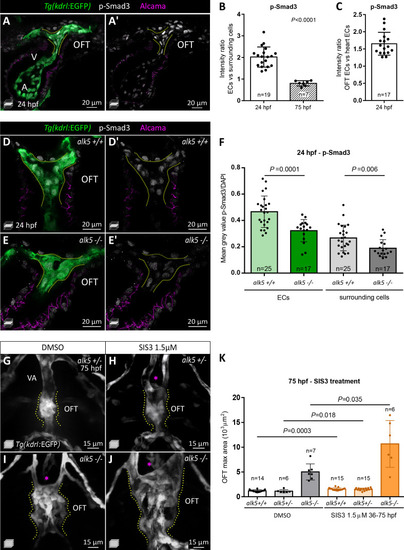
(A, A?) 24 hpf Tg(kdrl:EGFP) alk5+/+ hearts immunostained for p-Smad3 (white). Green, ECs; magenta, CMs. (B, C) Intensity ratio of p-Smad3 immunostaining (normalized to DAPI) between ECs and surrounding cells at 24 and 75 hpf (B) and between OFT ECs and heart ECs in 24 hpf alk5+/+ embryos (C). Every dot represents the ratio for one embryo. (D?E?) 24 hpf Tg(kdrl:EGFP) alk5+/+ (D) and alk5-/- (E) hearts immunostained for p-Smad3 (white). (F) Quantification of p-Smad3 immunostaining (normalized to DAPI) in ECs and surrounding cells comparing 24 hpf alk5+/+ and alk5-/- OFTs. (G?J) Confocal images of the OFT in 75 hpf Tg(kdrl:EGFP) alk5+/- (alk5a-/-;alk5b+/-; G, H) and alk5-/- (I, J) larvae treated with DMSO (G, I) or SIS3 (H, J) from 36 until 75 hpf. Asterisks point to the absence of the VA. (K) OFT maximum area in 75 hpf larvae treated with DMSO or SIS3. (A?J) Dotted lines outline the OFT ECs. (B, C, F, K) Plot values represent means � SD; p values from Mann Whitney (B, K) and t-test (F). In K, p values refer to the comparisons highlighted. Scale bars: (A, A?, D?E?) 20 ?m; (G?J) 15 ?m. See also Figure 2?figure supplement 1 and Figure 2?source data 1 and 2. EXPRESSION / LABELING:
PHENOTYPE:
|

( |
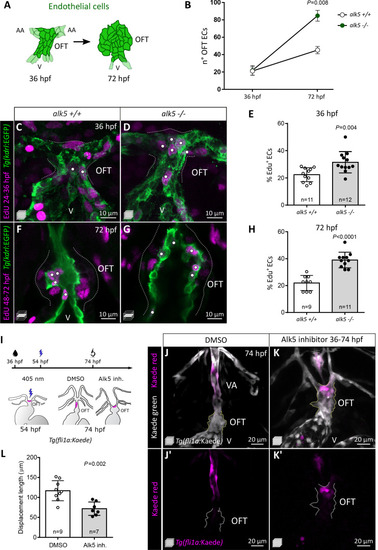
(A) Schematics of OFT ECs at 36 and 72 hpf. (B) Quantification of EC number (darker cells shown in A) in 36 and 72 hpf alk5+/+ and alk5-/- OFTs (36 hpf: n = 11; 72 hpf: n = 6). (C?H) Confocal images (C, D, F, G) and quantification (E, H) of the percentage of EdU+ ECs in Tg(kdrl:EGFP) alk5+/+ and alk5-/- OFTs. Dotted lines outline the OFT; white dots mark EdU+ ECs. All the other EdU+ cells in the OFT region are kdrl:EGFP-. (I) Protocol used for photoconversion experiment. (J?K?) Confocal images of the OFT in 74 hpf Tg(fli1a:Kaede) larvae treated with DMSO or Alk5 inhibitor. Magenta, photoconverted ECs; dotted lines outline the OFT. (L) Quantification of the distance covered by photoconverted ECs between 54 and 72 hpf in DMSO and Alk5 inhibitor-treated larvae. (C, D, J?K?) Maximum intensity projections. (F, G) Single confocal planes. (B, E, H, L) Plot values represent means � SD; p values from t-tests (E, H) or Mann Whitney (B, L). Scale bars: (C-G) 10 ?m; (J?K?) 20 ?m. See also Figure 3?figure supplement 1. EXPRESSION / LABELING:
PHENOTYPE:
|
( |
( EXPRESSION / LABELING:
PHENOTYPE:
|
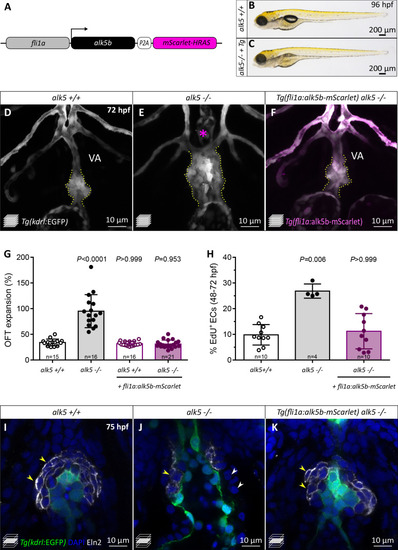
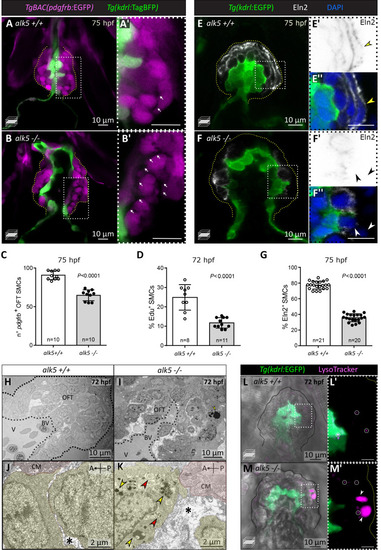
(A) Schematic of the construct used for endothelial-specific rescue experiments. (B, C) Brightfield images of 96 hpf alk5+/+ and alk5-/- larvae carrying the EC-specific alk5b rescue transgene (Tg). (D?F) Confocal images of the OFT in 72 hpf Tg(kdrl:EGFP) larvae, showing the morphological rescue in Tg(fli1a:alk5b-mScarlet) alk5-/- animals (F). Asterisk indicates the absence of the VA in alk5 mutants; dotted lines outline the OFT. (G) Percentage of OFT expansion in 78 hpf alk5+/+, alk5-/-, and Tg(fli1a:alk5b-mScarlet) alk5-/- animals. (H) Percentage of EdU+ ECs in 72 hpf alk5+/+, alk5-/-, and Tg(fli1a:alk5b-mScarlet) alk5-/- animals. (I?K) Confocal images of 75 hpf Tg(kdrl:EGFP) larvae immunostained for Eln2. Arrowheads, SMCs devoid of (white) or surrounded by (yellow) Eln2 immunostaining; I, n = 12; J, n = 13, K, n = 17. (G, H) Plot values represent means � SD; p values from Kruskal-Wallis test, compared with the first column (alk5+/+). VA- ventral artery; Tg- Tg(fli1a:alk5b-mScarlet). Scale bars: (B, C) 200 ?m; (D?F, I?K) 10 ?m. See also Figure 5?figure supplement 1. |

( |

(A, B) Whole-mount in situ hybridization for fbln5 expression in the OFT of 72 hpf alk5+/+ (n = 13) and alk5-/- (n = 12) larvae. Dotted lines outline the OFT. (C, C?) Fluorescent in situ hybridization for fbln5 expression (white) in the OFT of 36 hpf wild-type embryos. Green, ECs. Dotted lines outline the OFT, boxed area is shown in Figure 6?figure supplement 2B,B?. (D?F) Confocal images of 85 hpf Tg(kdrl:dsRed) alk5+/+ (n = 7), alk5-/- (n = 9), Tg(fli1:fbln5) alk5-/- (n = 9) larvae, showing the partial morphological rescue of the OFT and VA in Tg(fli1:fbln5) alk5 -/- larvae (6/9, F). Asterisk indicates the absence of the VA in alk5 mutants; dotted lines outline the OFT. (G) Percentage of OFT expansion in 78 hpf alk5+/+, alk5-/-, and Tg(fli1:fbln5) alk5-/- animals. (H) Percentage of SMCs surrounded by Eln2 immunostaining (per sagittal plane) at 75 hpf. (I?K) Confocal images of 75 hpf larvae immunostained for Eln2. Yellow arrowheads, SMCs surrounded by Eln2 immunostaining; I, n = 7; J, n = 7; K, n = 11. (G, H) Plot values represent means � SD; p values from Kruskal-Wallis tests, compared with the first column (alk5+/+). AA- aortic arch, VA- ventral artery. Scale bars: (A, B) 50 ?m; (C, C?, I?K) 10 ?m; (D?F) 15 ?m. See also Figure 6?figure supplements 1?2. EXPRESSION / LABELING:
|
( |

( |