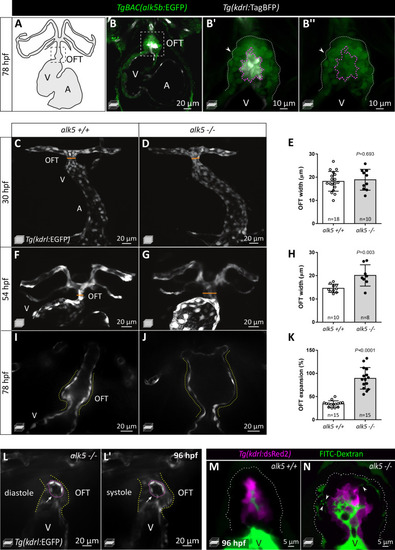
(A) Schematic of the zebrafish heart and connecting vessels at 78 hpf; ventral view; black, endothelium/endocardium. (B–B’’) Confocal images showing TgBAC(alk5b:EGFP) expression (green) in the 78 hpf zebrafish heart. White, ECs; arrowheads, SMCs; boxed area shown in B’ and B’’; white dotted lines outline the OFT; magenta dotted lines outline ECs. (C–H) Confocal images (C, D, F, G) and quantification (E, H) of OFT width in alk5+/+ and alk5-/- embryos at 30 (C–E) and 54 (F–H) hpf. Orange line shows OFT width graphed in E and H. (I–K) Frames of confocal movies of beating hearts (I, J) and quantification of OFT expansion (K) at 78 hpf. For details about the quantifications, see Materials and methods ‘Defining the landmarks of the OFT’. (L, L’) Frames of confocal movies of 96 hpf alk5-/- beating hearts during ventricular diastole (L) and systole (L’). Pink dotted lines outline ECs surrounding the rupture; arrows point to the site of EC rupture; yellow dotted lines outline the OFT. (M, N) Confocal images of 96 hpf alk5+/+ and alk5-/- OFTs showing the accumulation (arrowheads) of FITC-Dextran (green) between the SMCs in alk5-/- OFTs (7/11; alk5+/+ 0/10). Magenta, ECs; dotted lines outline the OFT. (C–G) Maximum intensity projections. (B, I–N) Single confocal planes. (E, H, K) Plot values represent mean ± SD; p values from t-tests. A- atrium, V- ventricle. Scale bars: (B, C–L’) 20 μm; (B’, B’’) 10 μm; (M, N) 5 μm. See also Figure 1—figure supplement 1.
|
