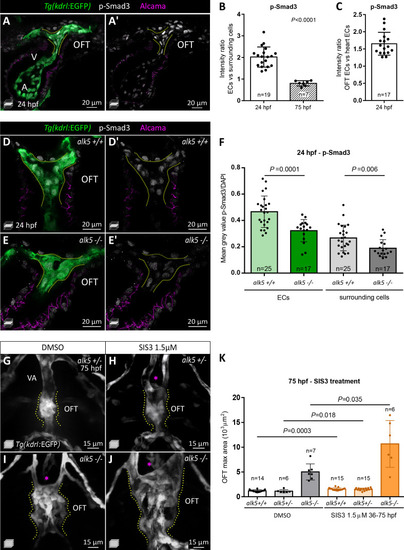
(A, A’) 24 hpf Tg(kdrl:EGFP) alk5+/+ hearts immunostained for p-Smad3 (white). Green, ECs; magenta, CMs. (B, C) Intensity ratio of p-Smad3 immunostaining (normalized to DAPI) between ECs and surrounding cells at 24 and 75 hpf (B) and between OFT ECs and heart ECs in 24 hpf alk5+/+ embryos (C). Every dot represents the ratio for one embryo. (D–E’) 24 hpf Tg(kdrl:EGFP) alk5+/+ (D) and alk5-/- (E) hearts immunostained for p-Smad3 (white). (F) Quantification of p-Smad3 immunostaining (normalized to DAPI) in ECs and surrounding cells comparing 24 hpf alk5+/+ and alk5-/- OFTs. (G–J) Confocal images of the OFT in 75 hpf Tg(kdrl:EGFP) alk5+/- (alk5a-/-;alk5b+/-; G, H) and alk5-/- (I, J) larvae treated with DMSO (G, I) or SIS3 (H, J) from 36 until 75 hpf. Asterisks point to the absence of the VA. (K) OFT maximum area in 75 hpf larvae treated with DMSO or SIS3. (A–J) Dotted lines outline the OFT ECs. (B, C, F, K) Plot values represent means ± SD; p values from Mann Whitney (B, K) and t-test (F). In K, p values refer to the comparisons highlighted. Scale bars: (A, A’, D–E’) 20 μm; (G–J) 15 μm. See also Figure 2—figure supplement 1 and Figure 2—source data 1 and 2.
|
