
- Title
-
BMP Signaling Gradient Scaling in the Zebrafish Pectoral Fin
- Authors
- Mateus, R., Holtzer, L., Seum, C., Hadjivasiliou, Z., Dubois, M., Jülicher, F., Gonzalez-Gaitan, M.
- Source
- Full text @ Cell Rep.

ZFIN is incorporating published figure images and captions as part of an ongoing project. Figures from some publications have not yet been curated, or are not available for display because of copyright restrictions. PHENOTYPE:
|
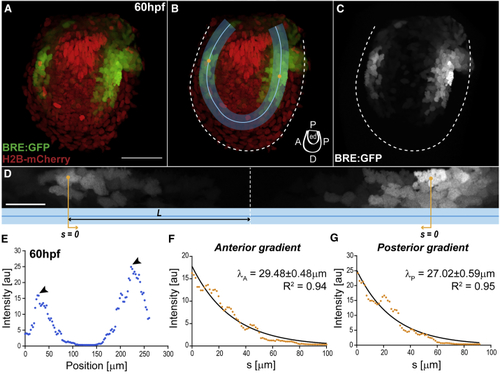
BMP Signaling Gradients in the Pectoral Fin (A–C) Fin of double transgenic BRE:GFP (green) and Histone2b-mCherry (red), at 60 hpf. The BRE reporter expresses GFP under the control of Smad1/5/8 enhancers from the mouse Id1 promoter ( (B) Region of interest (ROI, blue; with ROI midline) where gradients are deployed: endoskeletal disc, abutting the fin fold. Cartoon indicates fin axes and endoskeletal disc (ed). (D) BRE:GFP gradient along the straightened ROI (blue; anterior left) from (B). Orange lines indicate position Scale bars: 50 μm (A–C), 20 μm (D). (E) BRE:GFP intensity profile along the ROI midline from (B)–(D), at 60 hpf. Arrowheads, intensity maxima. Intensity corresponds to signal average orthogonal to midline. (F and G) Anterior (F) and posterior (G) intensity profiles from (E) versus position See also EXPRESSION / LABELING:
|

Pectoral Fin Growth (A–F) Scanning electron micrographs of larvae (A–C) and fins (D–F) at different times. Cartoon indicates fin orientation. (G–I) DAPI (blue) and Phospho-histoneH3 immunostainings (red) at different times. (J–L) Overlay of fins expressing zGeminin. LUT shows number of overlaid zGeminin+ nuclei per pixel. Dashed line, fin boundary. Distal, down; anterior, left. (M) PD and AP fin lengths from SEM images. (N) Number of phospho-histoneH3 cells per 10,000 μm2 at different times. Line, exponential fit with goodness of fit (R2). (O) Log-log plot of AP versus PD lengths to determine anisotropy Black dots, average from developmental time bins. Mean ± SEM are shown in all graphs. n represents total number of fins analyzed/overlaid. Scale bars, 100 μm (A–C), 50 μm (D–L). |
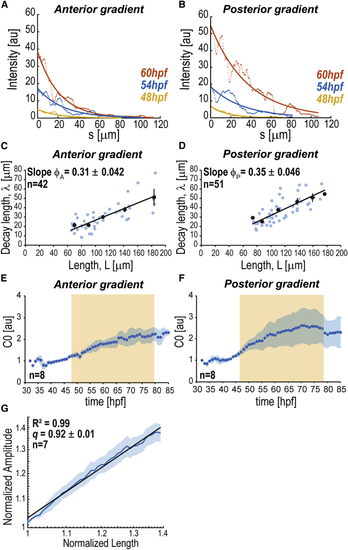
Scaling of BMP Signaling Gradients (A and B) BRE:GFP gradients at different times as a function of the distance to intensity maxima ( (C and D) Decay length versus ROI half-length (E and F) Average dynamics of gradient amplitude ( (G) Log-log plot of normalized average amplitude Shadowing corresponds to SEM per time point (E, F) or length (G). n represents number of fins analyzed. BRE:GFP transgene used: BRE:eGFP ( |
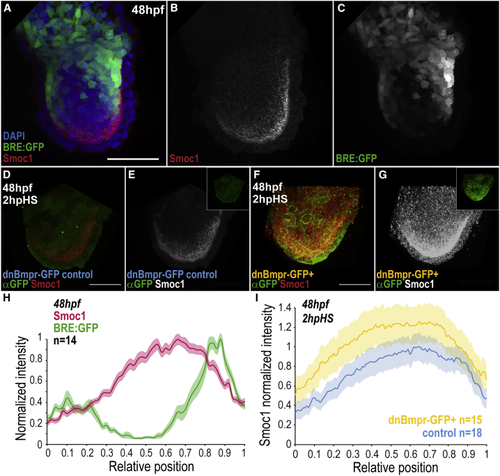
Smoc1 Is Repressed by BMP Signaling (A–C) BRE:GFP signal (green) and Smoc1 immunostaining (red) in the fin, at 48 hpf. (D–G) Smoc1 expression pattern at 2 h post-heat-shock induction (hpHS) of a dominant-negative BMP receptor transgene (dnBmpr-GFP+) or in sibling controls (for heat-shock conditions, see (H) Average intensities of normalized Smoc1 immunostainings and BRE:GFP signal versus relative position (ROI midline), at 48 hpf. Intensities were normalized to respective maxima. (I) Average intensity of normalized Smoc1 immunostainings versus relative position (ROI midline) in dnBmpr-GFP+ transgenics and siblings control. Smoc1 intensity in dnBmpr-GFP+ was normalized to the control maxima. Shadowing corresponds to SEM per relative position (H, I). Scale bars, 50 μm. n represents number of fins analyzed. Anterior, left; distal, down. BRE:GFP transgene used: BRE:eGFP ( EXPRESSION / LABELING:
|
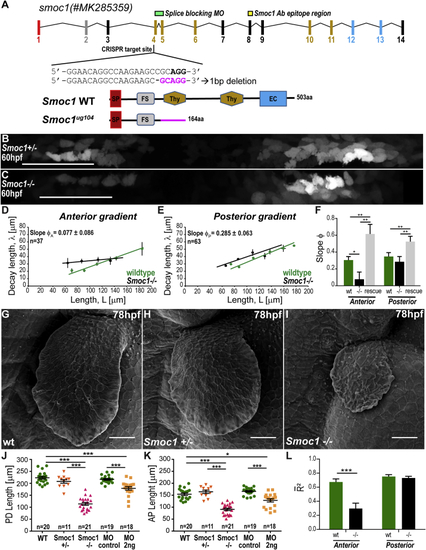
Smoc1 Mutants Scaling Phenotype (A) (B and C) BRE:GFP gradients in (D and E) Decay length versus ROI half-length (F) Comparison of (G–I) Scanning electron micrographs of wild-type (G), (J and K) Average PD (J) and AP (K) fin lengths at 78 hpf in different mutant and morphant (MO) conditions. (L) Comparison of average goodness of fit, For all statistical analyses: ∗∗∗p < 0.0001; ∗∗p < 0.01, ∗p < 0.05; two-tailed, unpaired, non-parametric Mann-Whitney tests. Mean ± SEM are shown in all graphs. Anterior, left; distal down. Scale bars, 50 μm. BRE:GFP transgene used: BRE:eGFP ( PHENOTYPE:
|