
- Title
-
TNFα Induces Müller Glia to Transition From Non-proliferative Gliosis to a Regenerative Response in Mutant Zebrafish Presenting Chronic Photoreceptor Degeneration
- Authors
- Iribarne, M., Hyde, D.R., Masai, I.
- Source
- Full text @ Front Cell Dev Biol
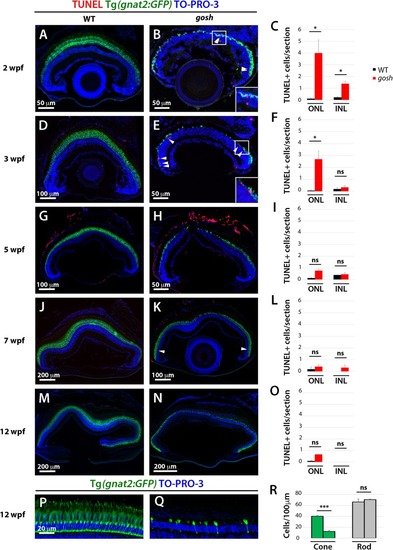
Retinal apoptosis occurs transiently at 2–3 wpf and ceases by 5 wpf in EXPRESSION / LABELING:
PHENOTYPE:
|
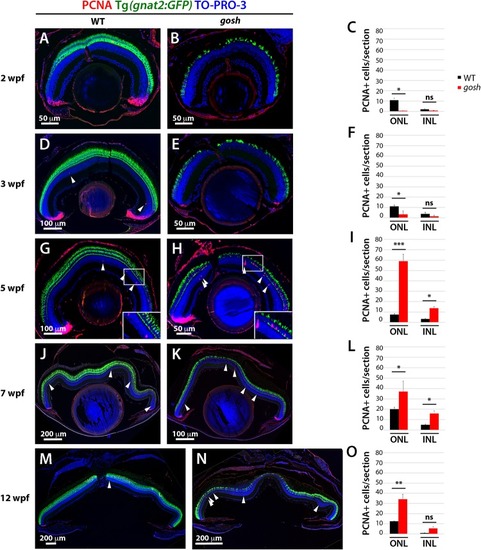
Proliferation of Müller glia, NPCs, and rod precursors starts after 5 wpf in EXPRESSION / LABELING:
PHENOTYPE:
|
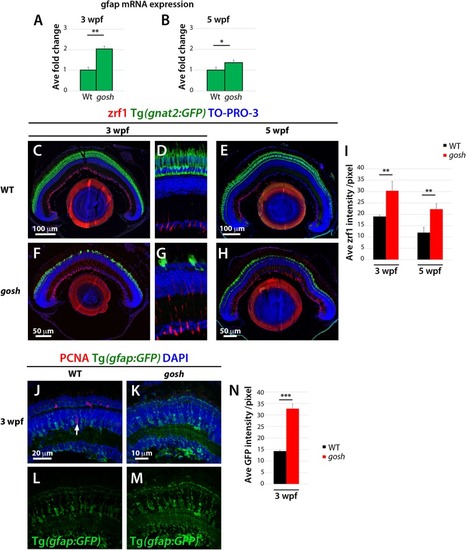
Non-proliferative gliotic response in EXPRESSION / LABELING:
PHENOTYPE:
|

TNFα is detected in cones at 5 wpf and in Müller glia at 7 wpf in EXPRESSION / LABELING:
PHENOTYPE:
|
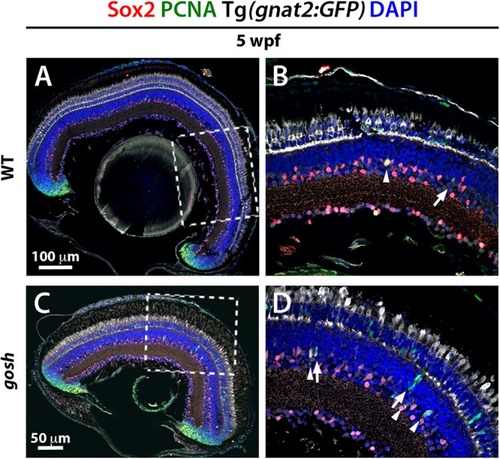
Müller glia express Sox2 during the regeneration response in EXPRESSION / LABELING:
PHENOTYPE:
|

NPCs express Pax6 during the regenerative response in EXPRESSION / LABELING:
|

Proliferation of Müller glia and rod precursor cells is not activated by light-induced damage, but by TNFα in EXPRESSION / LABELING:
PHENOTYPE:
|

ZFIN is incorporating published figure images and captions as part of an ongoing project. Figures from some publications have not yet been curated, or are not available for display because of copyright restrictions. EXPRESSION / LABELING:
PHENOTYPE:
|
|
ZFIN is incorporating published figure images and captions as part of an ongoing project. Figures from some publications have not yet been curated, or are not available for display because of copyright restrictions. EXPRESSION / LABELING:
PHENOTYPE:
|
|
ZFIN is incorporating published figure images and captions as part of an ongoing project. Figures from some publications have not yet been curated, or are not available for display because of copyright restrictions. PHENOTYPE:
|