
- Title
-
Shaping the zebrafish myotome by intertissue friction and active stress
- Authors
- Tlili, S., Yin, J., Rupprecht, J.F., Mendieta-Serrano, M.A., Weissbart, G., Verma, N., Teng, X., Toyama, Y., Prost, J., Saunders, T.E.
- Source
- Full text @ Proc. Natl. Acad. Sci. USA

The chevron architecture of the future myotome emerges early after segmentation from the presomitic mesoderm (PSM). (A) Sketch of a 21-somite zebrafish embryo. Transverse plane to AP axis is shown in red. Two somites, at stages S1 and S3, are highlighted. (B) Sketch of S3-stage somite (t≈90 min postsegmentation) in the transverse plane. Dark blue (red) cells are future slow (fast) muscle cells, respectively. The dark and light blue planes represent the cross-sectional views shown in C and D. The notochord is at the center, with the neural tube (light blue) located more dorsally and ventral tissues below (yellow). (C and C′) Cartoon of somite shape after segmentation: (C) plane lying z=8μm from notochord and underlying tissues and (C′) plane crossing the notochord, neural tube, and ventral tissues. Inset shows shape of somites superimposed on underlying tissues. (D and D′) Confocal images of embryos expressing Lyn-td-Tomato and superimposed contours of (D) somites and PSM (red lines) and (D′) neural tube, notochord, and ventral tissues (blue, green, and yellow lines, respectively) at t=0,100,300 min postsegmentation from PSM for midbody somites (i.e., around the red plane in Fig. 1A). (E) The 3D evolution of somite shape after segmentation from PSM of a representative wild-type embryo. (F) Cross-sectional area and solidity (ratio of somite area to area of its convex hull) of segmented somites for the most medial layer of future fast muscle fibers (as in D) as a function of time after segmentation. Shaded region represents ±1 SD. Average is performed over 11 somites from 6 embryos. |
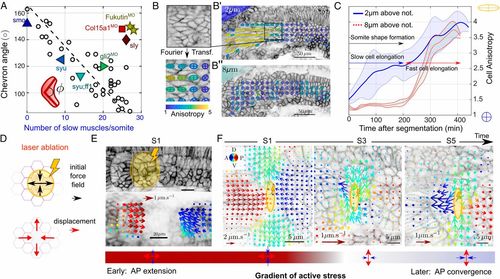
Slow muscle elongation leads to anisotropic stresses. (A) Chevron angle (in degrees) in most medial layer of future fast muscle fibers against number of slow muscles per somite at S4. Black circles: cyclopamine-treated embryos at different concentrations. Triangles: morpholinos and mutants affecting cell differentiation [dark blue △, smo (61); light blue ⊲, syu (62); cyan ▿, syu + ff1 (62); and green ⊳, gli2MO (41)]. Morpholinos or mutants altering tissue integrity [dark yellow ⋆, Fukutin (37); light red □, Col15a1aMO (36); dark red ⋄, sly (32, 63)]. See SI Appendix, SI Methods and Table S1 for further details (N=30 embryos and n=41 somites). (B) Fourier transform image analysis method (42) provides cell elongation field, with anisotropy represented by ellipsoids (SI Appendix, SI Methods). Cell elongation is along the major axis of the ellipse. (B′and B″) Elongation maps of future slow (B′, 2μm above notochord) and fast (B″, 8μm above notochord) muscle fibers. (C) Mean cell anisotropy after segmentation within a medial plane containing slow muscle fibers (solid blue line) and a more lateral plane, composed of fast muscle fibers (dashed red line). Shaded regions represent ±1 SD. Average is performed over 11 somites from 6 embryos. (D) Cartoon of predicted relaxation direction upon ablation of early somitic tissue. (E, Top) Laser ablation (yellow region) of somites expressing lyn-tdTomato at stages S0 and S1. (E, Bottom) Corresponding time-averaged tissue velocity from optic flow analysis in the 10s after ablation. Arrow color represents direction and length represents speed. (F) DV-orientated laser ablation at the DV midline of the medial layer of future fast fibers (yellow region), at different somite stages, with tissue velocity from optic flow analysis superimposed in the 10s after ablation. Color coding is as in E. Note the velocity scale is different for S1 compared to S3 and S5. (E and F, Bottom) Schematic of the inferred stress directions imposed by the ablated element on the tissue. |
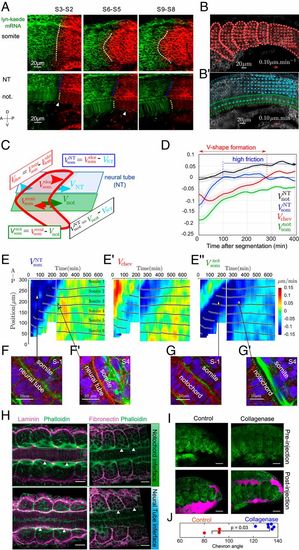
Differential tissue flow and tissue contact correlate with chevron emergence. (A) Lyn-Kaede showing relative movement of the somites (Top) with respect to the notochord and neural tube (Bottom) from S2 to S9. Kaede photoswitching was performed at the S2 stage in the more posterior somites (SI Appendix, SI Methods). Dashed lines highlight interfaces between the fluorescent regions. (B and B′) Velocity fields estimated by optic flow in WT embryos (SI Appendix, SI Methods) within the somite (som, red arrows, B), neural tube (NT, cyan arrows, B′) and notochord (not, green arrows, B′). (C) Definition of the mean AP velocities within each tissue. Color scheme is as in B. (D) Average relative tissue AP velocities (n=11 somites, N=5 embryos) after segmentation from the PSM. Shaded regions represent ±1 SD. (E, E′, and E″) Kymographs of shear velocities VNTsom, Vchev, and Vnotsom show somite-to somite reproducibility of the features identified in D. Each panel is from 2 embryos, with stitching at t=220 min. Black dots indicate the position of each somite’s center of mass along the AP axis, with somite labeling representing somite number with respect to the start of the movie. In E′, negative shear (blue colored region) indicates region of chevron shape emergence. (F and G) Confocal images of actin (green), laminin (red), and nuclei (blue) in transverse plane to the ML axis for somites S − 1 and S − 4. (Scale bar: 10μm.) (F and F′) Somite–neural tube interface at S − 1 (F) and S4 (F′). (G and G′) Somite–notochord interface at S − 1 (G) and S4 (G′). Arrows highlight correlation between actin localization and relative tissue velocities in E–E″. (H) Laminin (Left) and fibronectin (Right) antibody staining (SI Appendix, SI Methods) at the somite–notochord (Top row) and somite–neural tube (Bottom row) interfaces, imaged along the DV axis. Rightmost somite is in stage S1. Arrowheads highlight accumulation (or lack) of ECM components at the somite boundary with other tissues. (Scale bar: 20 μm.) (I) The 18-hpf embryos pre- and postinjection with collagenase or control. Green is Lyn-Td-Tomato and cyan is Dextran Alexa 647 showing the extracellular space. Postinjection images were taken 10 min after injection. (Scale bar: 25μm.) (J) Quantification of chevron angle 24 h postcollagenase injection. The 3 most posterior intact somites are quantified, along with the equivalent position in the control (P value from Mann–Whitney test). |