
Fig. 3
- ID
- ZDB-FIG-200326-53
- Publication
- Tlili et al., 2019 - Shaping the zebrafish myotome by intertissue friction and active stress
- Other Figures
- All Figure Page
- Back to All Figure Page
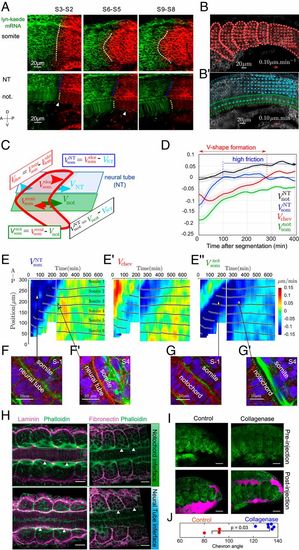
Differential tissue flow and tissue contact correlate with chevron emergence. (A) Lyn-Kaede showing relative movement of the somites (Top) with respect to the notochord and neural tube (Bottom) from S2 to S9. Kaede photoswitching was performed at the S2 stage in the more posterior somites (SI Appendix, SI Methods). Dashed lines highlight interfaces between the fluorescent regions. (B and B′) Velocity fields estimated by optic flow in WT embryos (SI Appendix, SI Methods) within the somite (som, red arrows, B), neural tube (NT, cyan arrows, B′) and notochord (not, green arrows, B′). (C) Definition of the mean AP velocities within each tissue. Color scheme is as in B. (D) Average relative tissue AP velocities (n=11 somites, N=5 embryos) after segmentation from the PSM. Shaded regions represent ±1 SD. (E, E′, and E″) Kymographs of shear velocities VNTsom, Vchev, and Vnotsom show somite-to somite reproducibility of the features identified in D. Each panel is from 2 embryos, with stitching at t=220 min. Black dots indicate the position of each somite’s center of mass along the AP axis, with somite labeling representing somite number with respect to the start of the movie. In E′, negative shear (blue colored region) indicates region of chevron shape emergence. (F and G) Confocal images of actin (green), laminin (red), and nuclei (blue) in transverse plane to the ML axis for somites S − 1 and S − 4. (Scale bar: 10μm.) (F and F′) Somite–neural tube interface at S − 1 (F) and S4 (F′). (G and G′) Somite–notochord interface at S − 1 (G) and S4 (G′). Arrows highlight correlation between actin localization and relative tissue velocities in E–E″. (H) Laminin (Left) and fibronectin (Right) antibody staining (SI Appendix, SI Methods) at the somite–notochord (Top row) and somite–neural tube (Bottom row) interfaces, imaged along the DV axis. Rightmost somite is in stage S1. Arrowheads highlight accumulation (or lack) of ECM components at the somite boundary with other tissues. (Scale bar: 20 μm.) (I) The 18-hpf embryos pre- and postinjection with collagenase or control. Green is Lyn-Td-Tomato and cyan is Dextran Alexa 647 showing the extracellular space. Postinjection images were taken 10 min after injection. (Scale bar: 25μm.) (J) Quantification of chevron angle 24 h postcollagenase injection. The 3 most posterior intact somites are quantified, along with the equivalent position in the control (P value from Mann–Whitney test). |