
Fig. 2
- ID
- ZDB-FIG-200326-52
- Publication
- Tlili et al., 2019 - Shaping the zebrafish myotome by intertissue friction and active stress
- Other Figures
- All Figure Page
- Back to All Figure Page
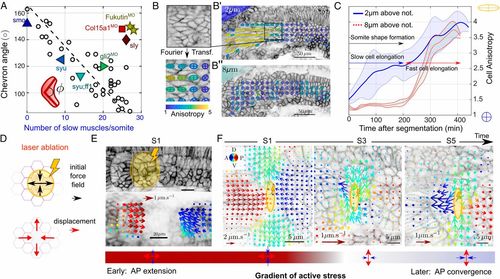
Slow muscle elongation leads to anisotropic stresses. (A) Chevron angle (in degrees) in most medial layer of future fast muscle fibers against number of slow muscles per somite at S4. Black circles: cyclopamine-treated embryos at different concentrations. Triangles: morpholinos and mutants affecting cell differentiation [dark blue △, smo (61); light blue ⊲, syu (62); cyan ▿, syu + ff1 (62); and green ⊳, gli2MO (41)]. Morpholinos or mutants altering tissue integrity [dark yellow ⋆, Fukutin (37); light red □, Col15a1aMO (36); dark red ⋄, sly (32, 63)]. See SI Appendix, SI Methods and Table S1 for further details (N=30 embryos and n=41 somites). (B) Fourier transform image analysis method (42) provides cell elongation field, with anisotropy represented by ellipsoids (SI Appendix, SI Methods). Cell elongation is along the major axis of the ellipse. (B′and B″) Elongation maps of future slow (B′, 2μm above notochord) and fast (B″, 8μm above notochord) muscle fibers. (C) Mean cell anisotropy after segmentation within a medial plane containing slow muscle fibers (solid blue line) and a more lateral plane, composed of fast muscle fibers (dashed red line). Shaded regions represent ±1 SD. Average is performed over 11 somites from 6 embryos. (D) Cartoon of predicted relaxation direction upon ablation of early somitic tissue. (E, Top) Laser ablation (yellow region) of somites expressing lyn-tdTomato at stages S0 and S1. (E, Bottom) Corresponding time-averaged tissue velocity from optic flow analysis in the 10s after ablation. Arrow color represents direction and length represents speed. (F) DV-orientated laser ablation at the DV midline of the medial layer of future fast fibers (yellow region), at different somite stages, with tissue velocity from optic flow analysis superimposed in the 10s after ablation. Color coding is as in E. Note the velocity scale is different for S1 compared to S3 and S5. (E and F, Bottom) Schematic of the inferred stress directions imposed by the ablated element on the tissue. |