
- Title
-
Developmental protein kinase C hyper-activation results in microcephaly and behavioral abnormalities in zebrafish
- Authors
- Liu, T., Shi, Y., Chan, M.T.V., Peng, G., Zhang, Q., Sun, X., Zhu, Z., Xie, Y., Sham, K.W.Y., Li, J., Liu, X., Ho, I.H.T., Gin, T., Lu, Z., Wu, W.K.K., Cheng, C.H.K.
- Source
- Full text @ Transl Psychiatry
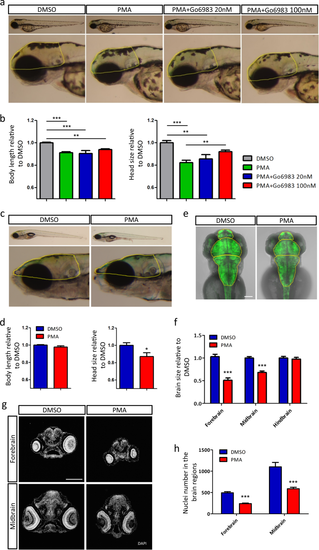
PKC overactivation during early development causes mild developmental delay and brain size deficit. a Lateral views of representative larvae (3 dpf) exposed to DMSO, PMA or PMA+Go6983. Head size was calculated with the boundary shown in yellow dotted line. b Quantitative representation of body length and head size (3 dpf) normalized to DMSO (DMSO n = 8, PMA n = 10, PMA+Go6983 20 nM n = 6, PMA+Go6983 100 nM n = 10, **p < 0.01, ***p < 0.001, one-way ANOVA). c Lateral views of representative larvae (9 dpf) previously exposed to DMSO or PMA. Head size was calculated with the boundary shown in yellow dotted line. d Quantitative representation of body length and head size (9 dpf) normalized to DMSO (DMSO n = 8, PMA n = 6, *p < 0.05, t-test analysis). e Dorsal views of zebrafish brains (3 dpf) visualized by Huc:GFP. Brain region was divided by yellow dotted line. Scale bar, 100 μm. f Quantitative representation of different brain regions normalized to DMSO (n = 16 per group, ***p < 0.001, t-test analysis). g DAPI staining of zebrafish head sections (3 dpf). Scale bar, 100 μm. h Nuclei number in forebrain and midbrain (n = 6 per group, ***p < 0.001, t-test) |
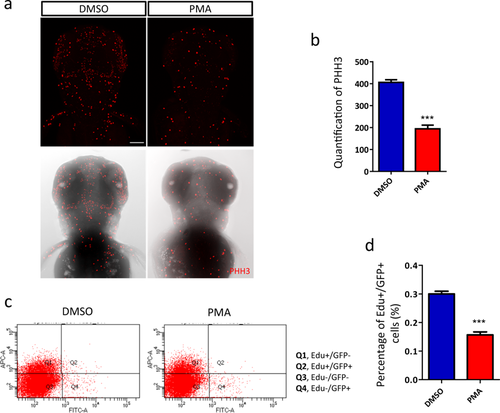
Aberrant PKC activation impaired neurogenesis. a, b Reduced mitotic cells in zebrafish head (3 dpf). a Fluorescence of pHH3-positive dots (the upper row) merged with brightfield images of zebrafish head (the lower row) (n = 26 per group, ***p < 0.001, t-test). Scale bar, 100 μm. c Flow cytometry analysis of the different populations of cells. d Newborn neurons (Q2) are significantly reduced in PMA-exposed fish (n = 9 per group, p < 0.001, t-test) |
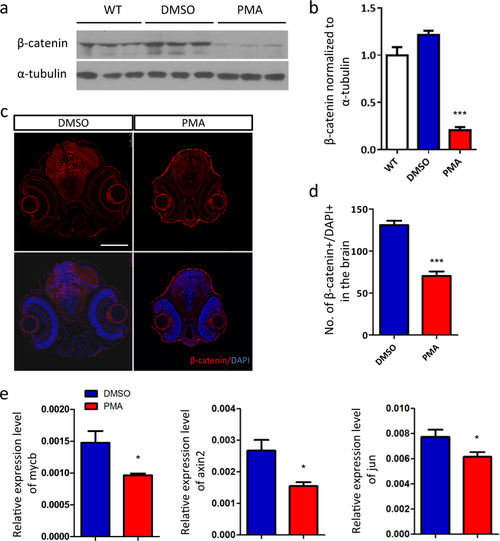
Excessive PKC signaling promotes the degradation of β-catenin. a Western blot analysis of β-catenin. b Quantification of the protein level of β-catenin relative to wild-type (WT) group (n = 3 per group, ***p < 0.001, t-test). c The nuclear accumulation of β-catenin is reduced by PMA treatment, d indicated by the quantification of β-catenin+/DAPI+ dots in brain region (n = 6 per group, ***p < 0.001, t-test). e RT-qPCR analysis of the transcriptional target of β-catenin, mycb, axin2 and jun (n = 6 per group, *p < 0.05, t-test) |
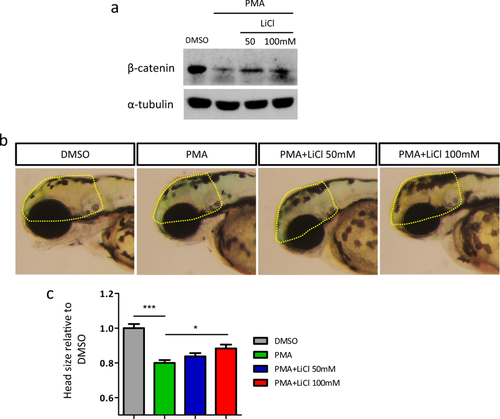
Stabilizing of β-catenin by gsk3β inhibition partially restores the head size deficit. a Western blot analysis of β-catenin. b Lateral views of representative larvae (3 dpf) exposed to DMSO, PMA or PMA+LiCl. Head size was calculated with the boundary shown in yellow dotted line. c Quantitative representation of body length and head size (3 dpf) normalized to DMSO (DMSO n = 14, PMA n = 18, PMA+LiCl 50 mM n = 12, PMA+LiCl 100 mM n = 18, *p < 0.05, ***p < 0.001, one-way ANOVA) |
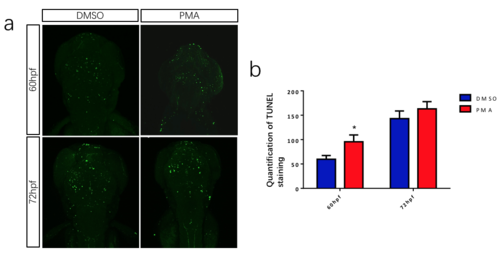
PKC over-activation induce a transient increase of cell apoptosis within the head. (a) TUNEL staining of zebrafish head. (b) Quantification of TUNEL signaling. (* p<0.05, t-test). |
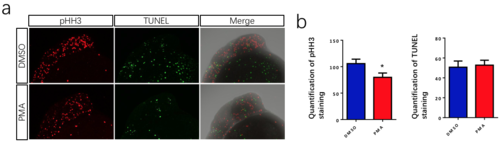
PKC hyper-activation has a mild effect on neurogenesis at 24hpf (a) pHH3 and TUNEL staining of zebrafish embryos. (b) Quantification of pHH3 and TUNEL staining within zebrafish head. (* p<0.05, t-test). |