
- Title
-
The Impact of Tumor Nitric Oxide Production on VEGFA Expression and Tumor Growth in a Zebrafish Rat Glioma Xenograft Model
- Authors
- Yousfi, N., Pruvot, B., Lopez, T., Magadoux, L., Franche, N., Pichon, L., Salvadori, F., Solary, E., Garrido, C., Laurens, V., Chluba, J.
- Source
- Full text @ PLoS One
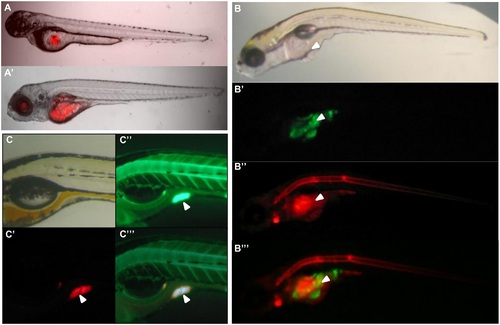
Nitric Oxide detection in xenografted glioma cells. (A) Embryos injected with CM-Dil labeled were cells imaged at 1dpi (A) and 4 dpi (A′). (B) Embryos injected with CellTrackerTM Green labeled cells were incubated at 4 dpi with DAR (20µM). The white arrow indicates the outgrowth. (B′) Green labeled glioma cells, (B′′) red DAR signal. The specific co-localization is reported in the merge (B′′′). (C) CM-Dil labeled glioma cells transplanted in the yolk and incubated with DAF (5 µM). Specific co-localization is reported in the merge (C′′′). White arrows indicate the tumor area. |
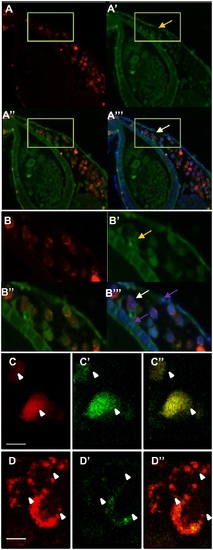
Histology of xenografted tumors and detection of NO in cells. Embryos engrafted with red fluorescent glioma cells and labelled with DAF-FM-DA. Embryos were fixed at 4dpi and sectioned at a 5µm thickness. NO production, detected with DAF signal (A′, A′′) was observed in cytoplasm and cell nuclei of tumor cells (yellow arrow). (B) Magnification of yellow framed areas. DAPI labeling was used to detect nuclei (B′′′), enabling detection of the large glioma nuclei and of a dividing tumor cell (white arrow); purple arrows indicate nuclei from zebrafish cells. (C), (D) In vivo images of CM-Dil labelled glioma cells taken with a biphoton confocal microscope in 4 dpi DAF treated embryos. White arrows indicate tumor cells. (C) CM-Dil labelled red fluorescent tumor cells, (C′′) DAF signal, (C′′′) merge. (D) Red fluorescent glioma cells in DAF and CPTIO treated embryos, (D′) CPTIO decreases DAF fluorescence intensity, showing the specificity of the DAF fluorescence. (D′′) merge. White arrows indicate the tumor cells. Scale bars are 10 µM |
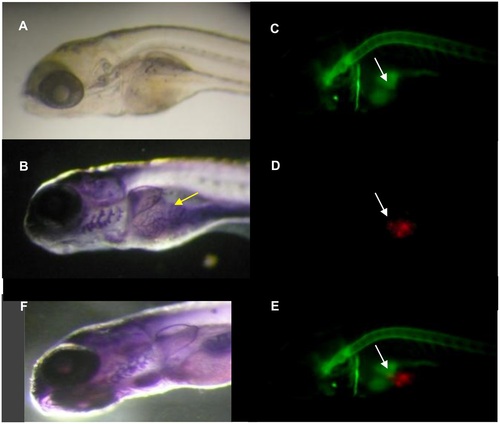
Alkaline phosphatase assay of xenografted DAF-FM-DA treated embryos. Embryos were injected with red CM-Dil labeled tumor cells, incubated at 4 dpi in DAF (5µM) and fixed at 4dpi before detection of alkaline phosphatase activity. (A) Bright field image of the embryos before treatments. (B) Neovascularisation was observed in 12 of 14 (85.5%) embryos presenting NO production in tumor environment. (D) Fluorescence detection of glioma cells, (C) DAF signal, (E) merge. The white arrows indicate the part of the tumor mass that co-localizes with DAF fluorescence signal. (F) A control embryo with absence of vessels in this region of the yolk. |

The effect of NO on tumor growth. CM-Dil labeled glioma cells were injected into the yolk of zebrafish embryos at 2 dpf and incubated with CPTIO (200µM). Images were taken at 1 dpi and 4 dpi. Images (A-A′′′) and (B-B′′′) show the tumors at 1 dpi and 4 dpi for control and CPTIO treated embryo. At 4 dpi, tumors have increased in size in untreated embryos (A′′-A′′′) in comparison to CPTIO treated embryos (B′′-B′′′). (C) Percentage of fluorescence intensity of the tumor surfaces was determined by ZEN software (n = 10). Images were taken with an Axio zoom V16 (Zeiss) macroscope, with the same exposure time for all embryos. Error bars represent SEM, *** p <0, 001, (one way ANOVA). (D) QRT-PCR analysis of Cyclin D1 gene expression in untreated and CPTIO treated xenografted embryos. Cyclin D1 expression was decreased upon CPTIO treatment. One representative experiment from four independent experiments is shown. |