
Image
|
Figure Caption
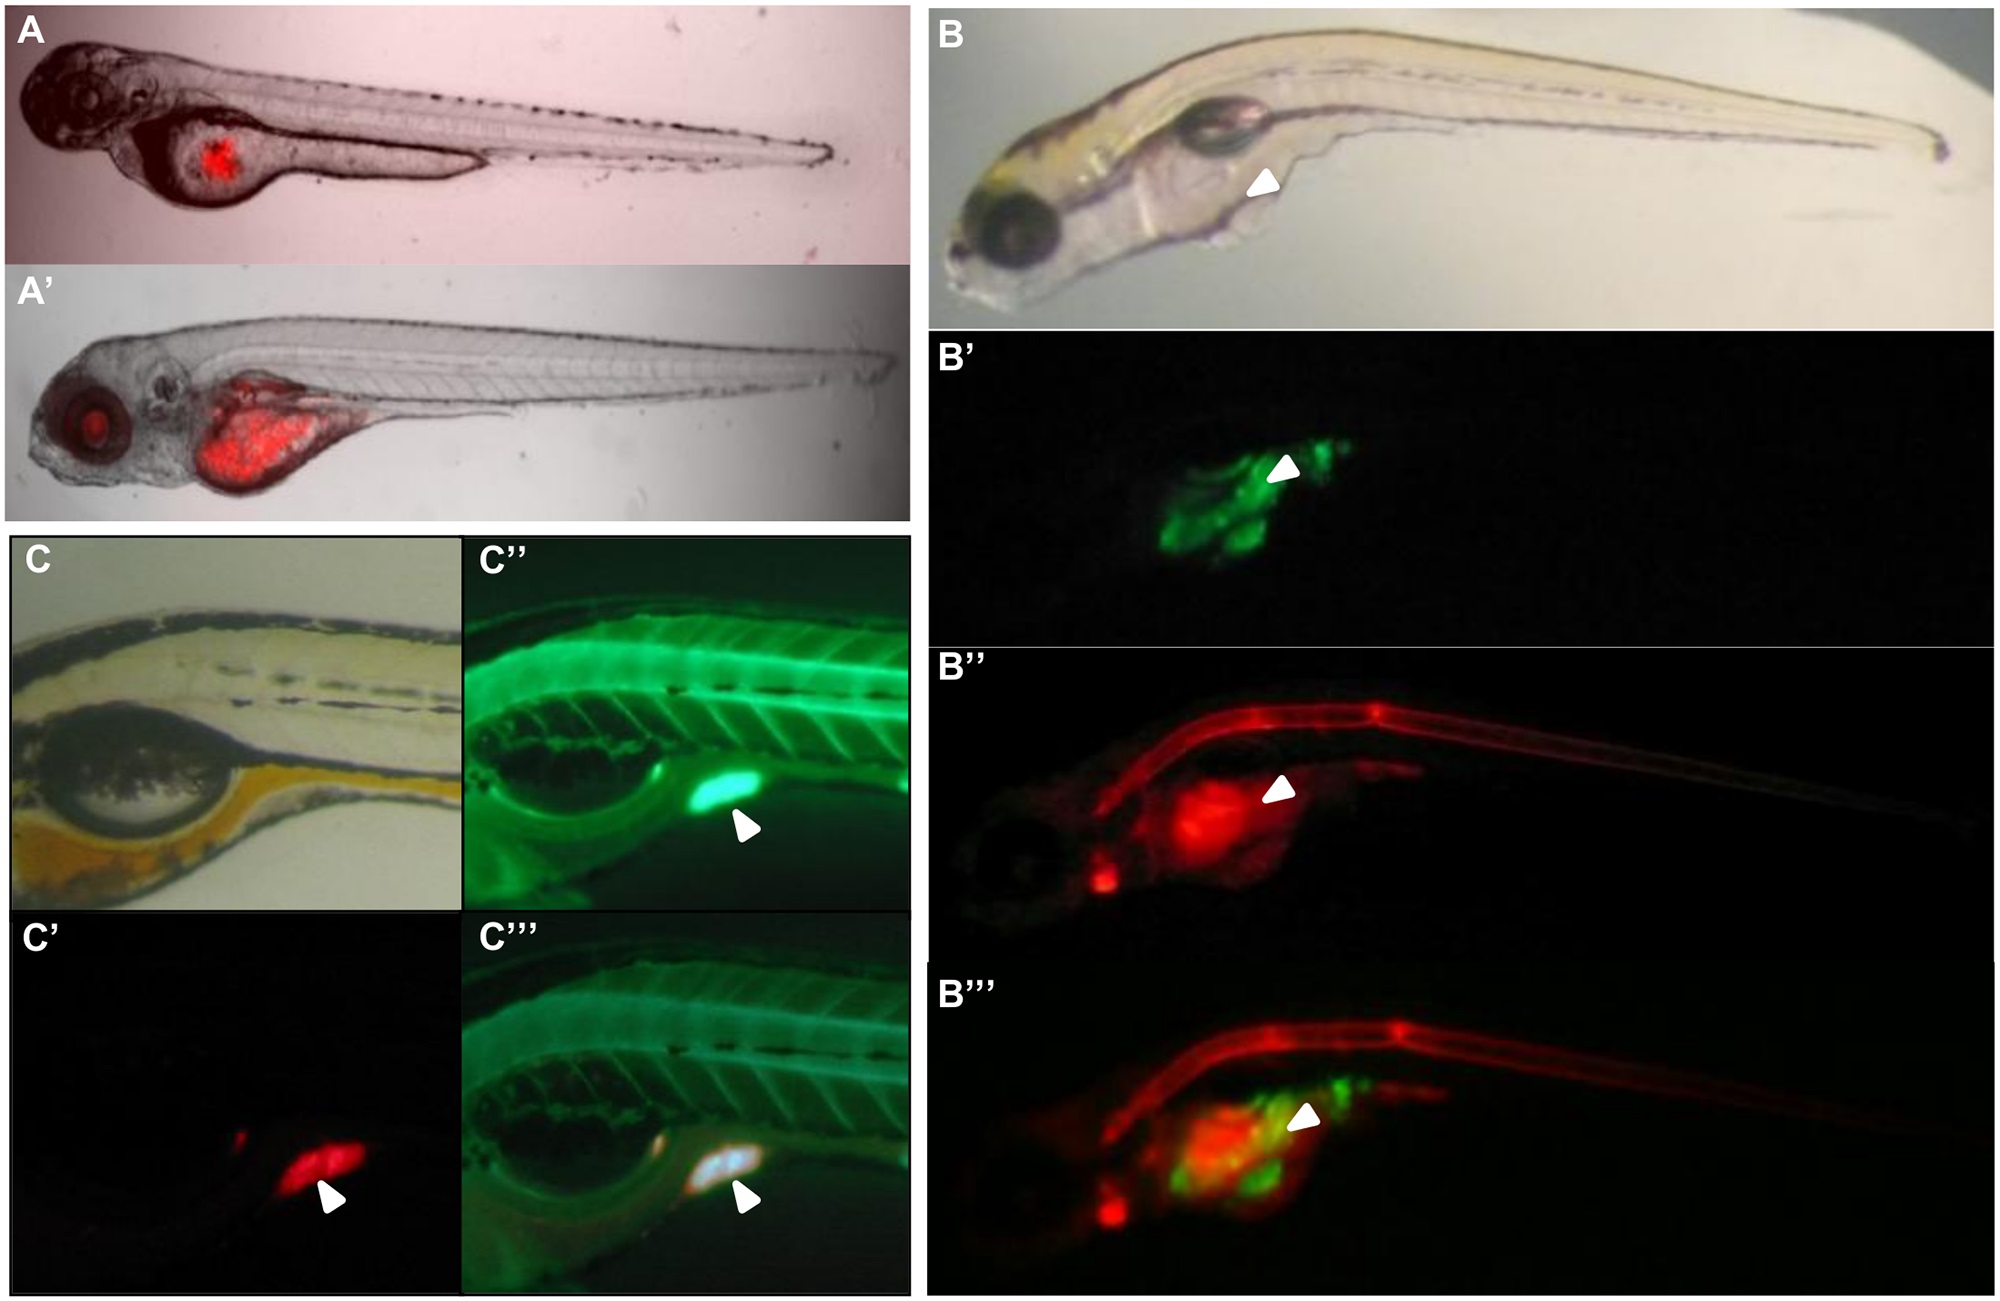
Fig. 1
Nitric Oxide detection in xenografted glioma cells.
(A) Embryos injected with CM-Dil labeled were cells imaged at 1dpi (A) and 4 dpi (A′). (B) Embryos injected with CellTrackerTM Green labeled cells were incubated at 4 dpi with DAR (20µM). The white arrow indicates the outgrowth. (B′) Green labeled glioma cells, (B′′) red DAR signal. The specific co-localization is reported in the merge (B′′′). (C) CM-Dil labeled glioma cells transplanted in the yolk and incubated with DAF (5 µM). Specific co-localization is reported in the merge (C′′′). White arrows indicate the tumor area.
Acknowledgments
This image is the copyrighted work of the attributed author or publisher, and
ZFIN has permission only to display this image to its users.
Additional permissions should be obtained from the applicable author or publisher of the image.
Full text @ PLoS One