
Fig. 2
- ID
- ZDB-FIG-150423-30
- Publication
- Yousfi et al., 2015 - The Impact of Tumor Nitric Oxide Production on VEGFA Expression and Tumor Growth in a Zebrafish Rat Glioma Xenograft Model
- Other Figures
- All Figure Page
- Back to All Figure Page
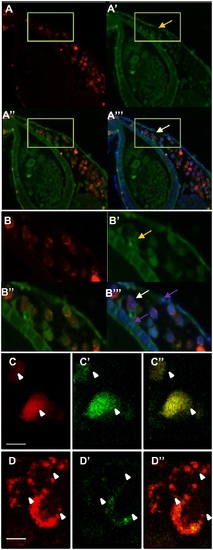
Histology of xenografted tumors and detection of NO in cells. Embryos engrafted with red fluorescent glioma cells and labelled with DAF-FM-DA. Embryos were fixed at 4dpi and sectioned at a 5µm thickness. NO production, detected with DAF signal (A′, A′′) was observed in cytoplasm and cell nuclei of tumor cells (yellow arrow). (B) Magnification of yellow framed areas. DAPI labeling was used to detect nuclei (B′′′), enabling detection of the large glioma nuclei and of a dividing tumor cell (white arrow); purple arrows indicate nuclei from zebrafish cells. (C), (D) In vivo images of CM-Dil labelled glioma cells taken with a biphoton confocal microscope in 4 dpi DAF treated embryos. White arrows indicate tumor cells. (C) CM-Dil labelled red fluorescent tumor cells, (C′′) DAF signal, (C′′′) merge. (D) Red fluorescent glioma cells in DAF and CPTIO treated embryos, (D′) CPTIO decreases DAF fluorescence intensity, showing the specificity of the DAF fluorescence. (D′′) merge. White arrows indicate the tumor cells. Scale bars are 10 µM |