
- Title
-
Loss of Optineurin In Vivo Results in Elevated Cell Death and Alters Axonal Trafficking Dynamics
- Authors
- Paulus, J.D., Link, B.A.
- Source
- Full text @ PLoS One

Optn is expressed ubiquitously in zebrafish embryos. Whole-mount images of in situ hybridization for optn in zebrafish embryos at 24 hpf (A, B) and 4 dpf (C, D). A and C are lateral mounts with anterior to the left and dorsal up. B and D are transverse sections of the head and eyes with dorsal up. A, B. optn expression is ubiquitous in the 24 hpf embryos (arrow) with some enrichment in the ventral head (arrowheads). C. optn expression at 4 dpf shows staining in the head (arrowhead) and higher enrichment in the otic vesicle (ov), swim bladder (sb) and intestine (i). D. Within the 4 dpf eye, optn expression is enriched in the retinal ganglion cell (arrow) and inner nuclear (arrowhead) layers. |
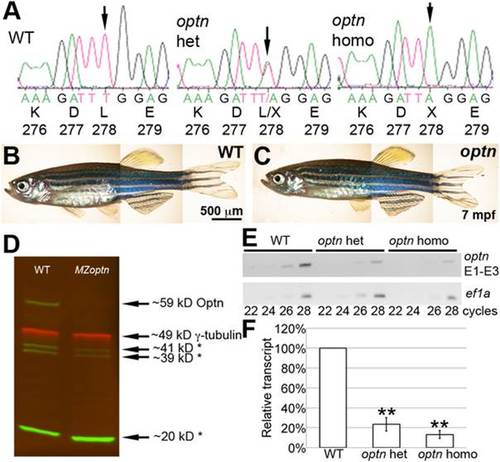
sa0143 is a null mutation of optn with reduced protein and transcript levels. A. Trace files from sequencing reactions of adult fish showing region of sa0143 mutation and corresponding amino acids. Arrow indicates mutated base. B, C. Live pictures of adult WT (B) and optn (C) fish showing no difference in morphology. D. Western blot of protein extracts from 3 dpf embryos. Green = anti-Optn, Red = anti-γ-tubulin as a loading control. Asterisks indicate likely non-specific bands. The Optn band is absent in the MZoptn lane. E. Representative gel of semi-quantitative RT-PCR run with cDNA from retinas of 6 mpf fish. Top blot was used with primers against exons 1-3 of optn, bottom blot was used with primers against ef1a as a loading control. PCR was stopped at cycle times indicated below the blots. F. Quantification of 3 semi-quantitative RT-PCR experiments. Levels were analyzed for 28-cycle bands and normalized to WT bands for each experiment. ** indicates p≤0.01. EXPRESSION / LABELING:
|
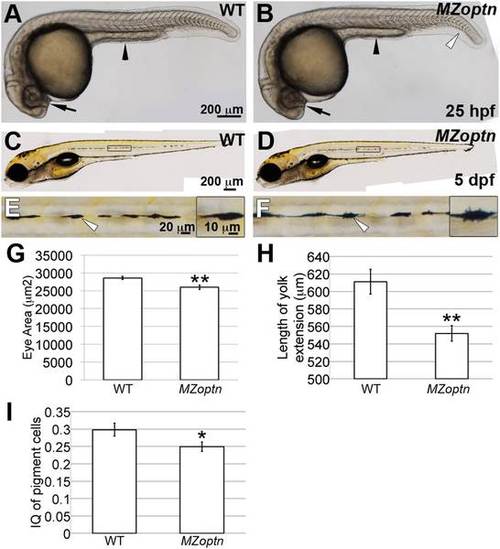
MZoptn embryos have subtle morphological defects at early developmental ages. A-F. Representative images of live WT (A, C, E) or MZoptn (B, D, F) embryos at 25 hpf (A, B) or 5 dpf (C-F). Anterior is to the left. A, B. The area of the eyes (arrows) and length of the yolk tube extension (arrowheads) are smaller in MZoptn embryos. MZoptn embryos occasionally have a curve to the tail (open arrowhead). C-F. Pigment cells in MZoptn embryos have more filopodia. E and F are higher magnification views of boxed areas in C and D. Insets in E and F are higher magnifications of pigment cells indicated by arrows. G-I. Quantification of eye size at 25 hpf (I), length of yolk tube extension at 25 hpf (J) and isoperimetric quotient of pigment cells at 5 dpf (K). * indicates p≤0.05, ** indicates p≤0.01. |
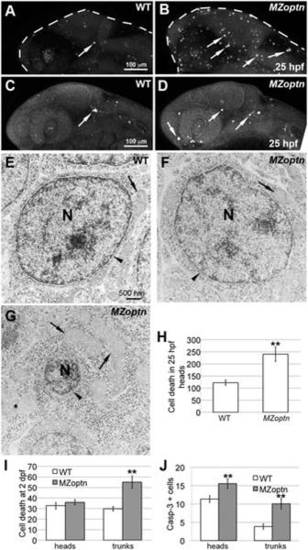
optn embryos have increased cell death. A–D. Compressed z-stacks of 25 hpf WT (A, C) or MZoptn (B, D) embryos labeling dying cells with Acridine Orange (A, B) or α-activated caspase-3 (C, D). Anterior is to the left and dorsal is up. A, B. MZoptn embryos have more Acridine Orange labeled cells (arrows). C, D. MZoptn embryos have more caspase-3 labeled cells (arrows). E–G. TEM images from cross sections of WT (E) or MZoptn embryos (F, G). E, F are normal looking cells, G is apoptotic cell. In G, the nucleus is condensed (N), the nuclear envelope is missing (arrowhead) and the mitochondria are enlarged (arrows) compared to normal cell sin E, F. H–J. Quantification of cell death by acridine orange staining in 25 hpf heads (H) or 2 dpf head and trunks (I) or caspase staining in 25 hpf heads and trunks (J). ** indicates p≤0.01. |
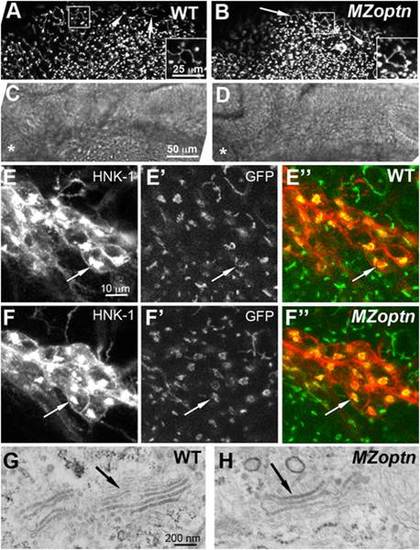
Golgi structure and axon guidance are normal in optn embryos. A–F. Compressed z-stacks of 25 hpf WT (A, C, E) or MZoptn (B, D, F) embryos labeled with man2a-EGFP (A, B, E′, E′′, F′, F′′) or α-HNK-1 (E, F) or brightfield images (C, D). Insets in A, B are higher magnification views of the boxed regions. C, D are brightfield images of the same regions shown in A, B. Anterior is to the left and dorsal is up. A–D. Man2a-GFP labeled Golgi are normal in the midbrain region of MZoptn embryos as seen in both the filamentous Golgi of epithelial cells (arrows) and compact Golgi of neuroepithelial cells (arrowheads). Asterisk indicates location of the eye. E, F. Co-labeling of the sensory trigeminal nucleus with HNK-1 (E, F), man2a-GFP (E′, F′) or the merge of the two channels (E′′, F′′). The Golgi looks normal in MZoptn embryos (arrows). G, H. TEM images of the Golgi in epithelial cells of the head in 25 hpf embryos shows no difference in structure between WT (G) and MZoptn (H) embryos (arrows). PHENOTYPE:
|
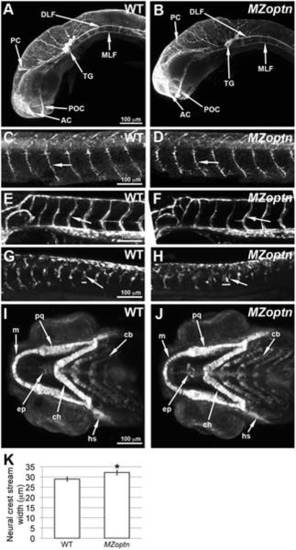
MZoptn embryos have defects in the migration of neural crest cells. A–J. Compressed z-stacks of WT (A, C, E, G, I) or MZoptn (B, D, F, H, J) embryos. Embryos are mounted laterally (A–H) or ventrally (I, J) with anterior to the left. A, B. α-acetylated alpha-tubulin staining of axon tracts in 25 hpf embryos. The MZoptn embryos have normal axon pathfinding (arrows). C, D. α-SV2 staining of spinal motor axons in 2 dpf embryos. These axons are guided normally in MZoptn embryos (arrows). E, F. GFP labeled endothelial cells in 2 dpf embryos show that intersegmental vessels are patterned correctly in MZoptn embryos (arrows). G, H. GFP labeling of neural crest cells in 23 hpf embryos. The ventrally directed streams of cells (arrows) in the trunk are in the right location, but the width of the streams is wider in MZoptn embryos along the anterior-posterior axis (horizontal bars correspond to width of above stream). I, J. GFP labeling of neural crest cells that are contributing to the jaw cartilage in 4 dpf embryos. The elements of the jaw cartilage in MZoptn embryos appear normal (arrows), including Meckel’s cartilage (m), palatoquadrate (pq), ceratohyal (ch), hyosympathetic (hs), ethmoid plate (ep) and ceratobranchials (cb). K. Quantification of the width of the neural crest streams in G, H. * indicates p≤0.05. PHENOTYPE:
|

MZoptn embryos have defects in the dynamics of vesicle trafficking. A–J, M–P. Frames from time-lapse imaging of Texas Red-dextran trafficked through longitudinal spinal axons in WT (A–H) or MZoptn (M–P) embryos. Moving puncta are indicated by arrows and time codes are indicated. WT punctum shown in A–K traveled a little slower than average. MZoptn punctum shown in L–P traveled faster than average. K, L. Quantification of the speed of indicated puncta of WT panels (K) or MZoptn panels (L). Each time-point corresponds to the average speed of the puncta over the preceding 15 seconds. Q–T. Quantification of all puncta from WT and MZoptn embryos showing overall speed of puncta (Q), speed of puncta when they are not pausing (R), % of time puncta spend pausing (S) and time that each puncta spends on individual pauses (T). * indicates p≤0.05. PHENOTYPE:
|