
Fig. 5
- ID
- ZDB-FIG-150211-22
- Publication
- Paulus et al., 2014 - Loss of Optineurin In Vivo Results in Elevated Cell Death and Alters Axonal Trafficking Dynamics
- Other Figures
- All Figure Page
- Back to All Figure Page
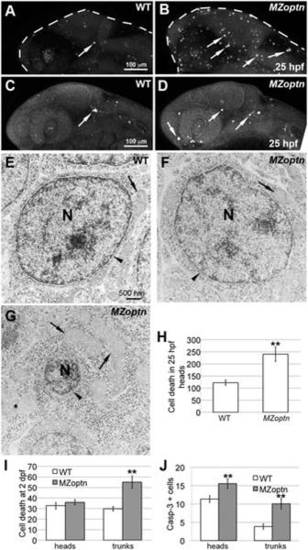
optn embryos have increased cell death. A–D. Compressed z-stacks of 25 hpf WT (A, C) or MZoptn (B, D) embryos labeling dying cells with Acridine Orange (A, B) or α-activated caspase-3 (C, D). Anterior is to the left and dorsal is up. A, B. MZoptn embryos have more Acridine Orange labeled cells (arrows). C, D. MZoptn embryos have more caspase-3 labeled cells (arrows). E–G. TEM images from cross sections of WT (E) or MZoptn embryos (F, G). E, F are normal looking cells, G is apoptotic cell. In G, the nucleus is condensed (N), the nuclear envelope is missing (arrowhead) and the mitochondria are enlarged (arrows) compared to normal cell sin E, F. H–J. Quantification of cell death by acridine orange staining in 25 hpf heads (H) or 2 dpf head and trunks (I) or caspase staining in 25 hpf heads and trunks (J). ** indicates p≤0.01. |
| Fish: | |
|---|---|
| Observed In: | |
| Stage Range: | Prim-5 to Long-pec |