
- Title
-
Left-right asymmetry is required for the habenulae to respond to both visual and olfactory stimuli
- Authors
- Dreosti, E., Vendrell Llopis, N., Carl, M., Yaksi, E., and Wilson, S.W.
- Source
- Full text @ Curr. Biol.
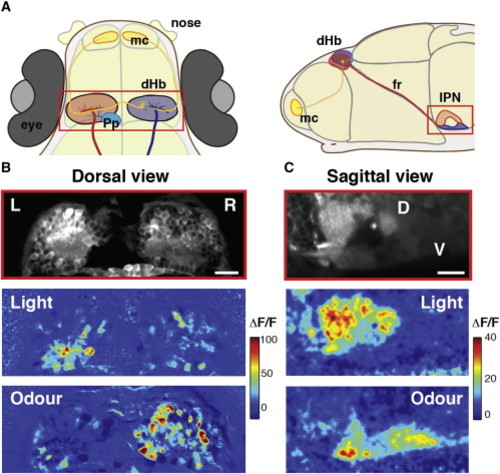
Responses to Visual and Odor Stimuli Are Lateralized in the dHb and Segregated Dorsoventrally in the IPN (A) Schematic dorsal and sagittal views of 4 days postfertilization (dpf) zebrafish showing left (red) and right (blue) dHb nuclei and their asymmetric afferents from olfactory mitral cells (yellow) arborizing in the right dHb nucleus and parapineal neurons (cyan) arborizing in the left dHb nucleus. Neurons of the left dHb predominantly innervate the dorsal IPN, while neurons of the right dHb innervate the ventral IPN. (B) Example of a two-photon image of a single z plane of the dHb (14 μm below the skin) of a Tg(elavl3:GCaMP5G) 4 dpf fish (top) and corresponding color-coded calcium signals that are LR lateralized in dHb neurons in response to a nonlateralized presentation of light (middle) and odor (bottom) stimuli. Each panel is an average of two stimulus trials. The relative change in fluorescence (ΔF/F) is expressed as a percentage. (C) Example of a two-photon image of a lateral view of the IPN of a Tg(elavl3:GCaMP5G) 4 dpf fish (top) and corresponding color-coded calcium responses to light (middle) and odor (bottom). Each panel is an average of three trails. Responses to light are predominantly localized in the dorsal IPN, while those to odor are localized in the ventral IPN. Note that the dorsal IPN has a higher basal fluorescence (as does the left dHb nucleus). Scale bars, 20 μm. D, dorsal; V, ventral; fr, fasciculus retroflexus; IPN, interpeduncular nucleus; dHb, dorsal habenulae; L, left; R, right; mc, mitral cells; Pp, parapineal. See also Figure S1. |
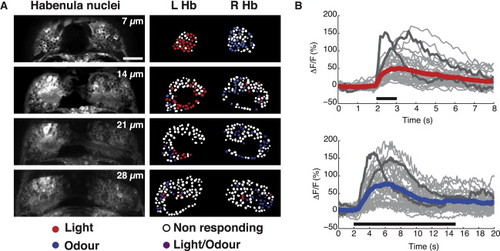
Functional Responses of Habenular Neurons to Visual and Odor Stimuli (A) Raw images of four z planes (at 7, 14, 21, and 28 μm depth from surface) of the dHb of a 4 dpf Tg(elavl3:GCaMP5G) wild-type fry. In the right panels, dHb neuron cell bodies, indicated as regions of interest (ROIs), are color coded in red, blue, violet, or white dependent upon their response to light, odor, both, or neither, respectively. To quantify the number of dHb neurons responding to light and odor, we analyzed the two most-dorsal planes (at 7 and 14 μm) that contained the majority of responding neurons. Only neurons with amplitude responses greater than 2 SDs from the baseline were considered as responding neurons. Neurons that showed inhibition of activity in response to stimulus presentation are not shown. Scale bar, 20 μm. (B) Graphs showing the time courses (averages of two stimulus presentations) of all individual neurons within one imaging plane, at 14 μm depth, to light (top) and odor (bottom) stimuli. Individual responses are shown in gray, the average of all responses is colored red or blue, and two neurons demonstrating the distinct kinetics of the sensory responses are highlighted in dark gray. The durations of the light and odor stimulation are indicated by the black bars; note the difference in time scale. See also Figure S2. |

Developmental Disruption of dHb Asymmetry Leads to Loss of Sensory Responses to Light or Odor (A–D) Confocal images of the epithalamus of wild-type (A), cold-shocked (B), parapineal-ablated (C), and IWR1-treated (D) Tg(foxD3:GFP × lhx2a:Gap43-YFP) 4 dpf fish showing normally lateralized (LR), reversed (RL), double-right (RR), and double-left (LL) epithalami. Olfactory mitral cell projections (white arrows) terminate in the right dHb nucleus in the wild-type brain (A), terminate in the left dHb in the reversed brain (B), are bilateral in the double-right brain (C), and are reduced/absent in the double-left brain (D). Parapineal neuron projections (pseudocolored cyan) terminate in the left dHb in the wild-type and double-left brain (A and D), terminate in the right dHb in the reversed brain (B), and are reduced/absent in the double-right brain (C). (E–H) Examples of single z planes of the dHb (as in Figures 1B and 2A) of wild-type (E), cold-shocked (F), parapineal-ablated (G), and IWR1-treated (H) Tg(foxD3:GFP × lhx2a:Gap43-YFP) 4 dpf fish as in (A)–(D) showing lateralization of neuronal responses to light and odor. Neuronal cell bodies are shown as ROIs color coded in red, blue, violet, or white depending on whether they responded to light, responded to odor, responded to both light and odor, or were nonresponding. Only neurons with amplitude responses greater than 2 SDs from the prestimulus baseline are considered as responding. Neurons that showed an inhibitory response are not shown. (I–L) Bar charts showing the percentages of light (red)- versus odor (blue)-responding neurons (normalized to the total number of dHb neurons) in the left and right dHb nuclei for two sampled planes (at depths of 7 and 14 µm) in multiple fish of each of the classes shown in (A)–(D). For the wild-type (I), an average of about 17% of neurons respond to light 20% to odor and 1% to both (n = 8 fish). The LR difference in light responses was significant (p = 4 × 10⁵), as was the LR difference in odor responses (p = 5 × 10⁴; p < 0.001, Student’s t test). For reversed fish (J), about 10% of dHb neurons respond on average to light, 14% to odor, and 0.6% to both. LR difference responses was significant to light (p = 0.0056) and odor (p = 0.0072) (n = 7 fish). In double-right-brained fish (K), 21% of neurons were odor responding, with light-responding neurons reduced to 0.5% and those responding to both to 0.2% (n = 8 fish), whereas double-left-brained fish (L) showed an increased percentage of neurons responding to light (35%), a reduced number responding to odor (3%), and 3% responding to both (n = 6 fish). Error bars indicate the SEM. (M–P) Sagittal views of the IPN in Tg(elavl3:GCaMP5G) 4 dpf fish showing excitation in response to light (red) and odor (blue), color coded depending on their ΔF/F responses. In the wild-type (M) and reversed (N) fish, light and odor responses are localized in the dorsal and ventral IPN, respectively. In the IPN of the double-left-brained fish (P), virtually all IPN responses were upon light stimulation, whereas in the double-right-brained fish (O), virtually all IPN responses were upon odor stimulation. Scale bars, 20 μm. D, dorsal; V, ventral; Pp, parapineal; mc, mitral cell axons and terminals; LHb, left habenula nucleus; R Hb, right habenula nucleus. See also Figures S3 and S4. |
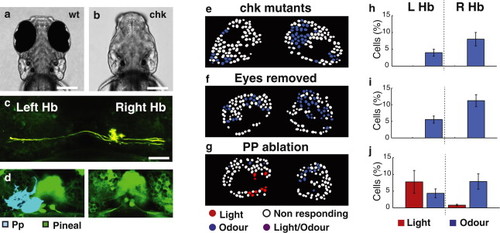
Asymmetric Responses of left dHb Neurons to Light Are Dependent upon the Eyes (A and B) Dorsal views of live wild-type (A) and chkne2611 mutant (B) fish at 4 dpf. (C) Dorsal view of the dHb nuclei in a chkne2611 mutant showing that mitral cells inputs remain asymmetrically directed to the right dHb. (D) Dorsal views of the epithalamus of a Tg(elavl3:GCaMP5G) 3 dpf fish prior (left) and 4 dpf fish subsequent (right) to ablation of the parapineal (pseudocolored blue). (E–G) Images of color-coded dHb neuron responses to light (red) and odor (blue) in single z plane of a 4 dpf Tg(foxD3:GFP × lhx2a:Gap43-YFP) chkne2611 mutant fish (E), a fish in which eyes were surgically removed at 1 dpf (F), and a Tg(foxD3:GFP × elavl3:GCaMP5G) embryo with late ablation of the parapineal (G). (H–J) Bar graphs showing average dHb neuron responses to light and odor for chk mutant (H) eye-ablated (I) and parapineal-ablated (J) fish. Fish without eyes show loss of dHb visual responses, whereas fish without a parapineal still show visual responses. For chkne2611 mutant and eye-ablated fish, an average of 12% (n = 6 fish) and 16% (n = 6 fish), respectively, of neurons responded to odor. For late parapineal-ablated fish (n = 3 fish), dHb neurons show an asymmetric distribution of responses to light (9% of neurons) and odor (11% of neurons) comparable with that of the wild-type. Error bars indicate the SEM. Scale bars, 20 μm. Hb, habenulae; Pp, parapineal; LHb, left habenula nucleus; R Hb, right habenula nucleus. |

Transgenic line used for imaging. (A-B) Dorsal (A) and sagittal (B) views of a 4dpf |
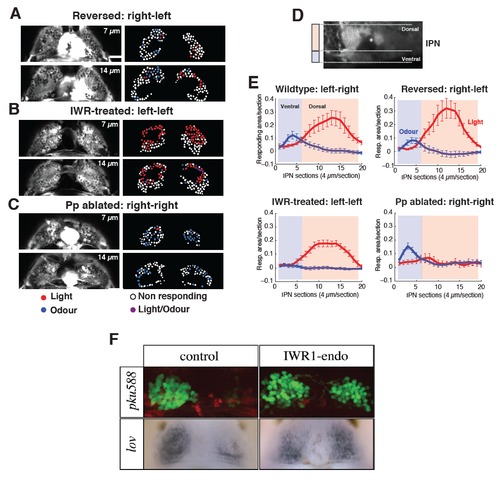
Functional responses to visual and odour stimulations in fish with reversed, double-left and double-right epithalami in the Hb and IPN. (A-F) Raw images of two z-planes (at 7 and 14 μm depth) of the dorsal Hb of 4 dpf Tg(elavl3:GCaMP5G) reversed (A), double-left (B), and double-right (C) brained fish (left panels). In the right panels, dHb neuron cell bodies, indicated as regions of interests (ROIs), are colour-coded in red, blue, violet, or white dependent upon their response to light, odour, both, or neither respectively. In the case of parapineal reversal Tg(elavl3:GCaMP5G) fish were crossed with the Tg(foxD3:GFP) fish to visualize the parapineal on the right side (A). For the Parapineal (Pp) ablation, Tg(elavl3:GCaMP5G) fish were crossed with Tg(foxD3:GFP) and Tg(flh:GFP) fish (C). Scale bar 20 μm. (D) Sagittal view of the IPN highlighting the dorsal (light red) and ventral (light blue) IPN. (E) Depth profile of averaged light (red line) and odour (blue) IPN responses from dorsal to ventral in wildtype, reversed, double-left, and double-right conditions. Red and blue lines are averages of three trials for each stimulus modality. (n=7 wildtype, n=6 reversed, n=8 double-left, and n=6 doubleright). (F) Dorsal views of the epithalami of control (left) and IWR1 treated (right) embryos showing expression of markers normally lateralized to the majority of left habenular neurons. Top shows the pku588 transgene (Lu Wen, Bo Zhang, Shou Lin, MC and SW, unpublished data) and B,B′ shows kcdt12.1 (Gamse et al., 2003) expression. IWR1-mediated suppression of Wnt-signalling leads to many right-sided habenular neurons expressing markers typical of the neurons on the left. This consequently leads to an overtly double-left phenotype. |
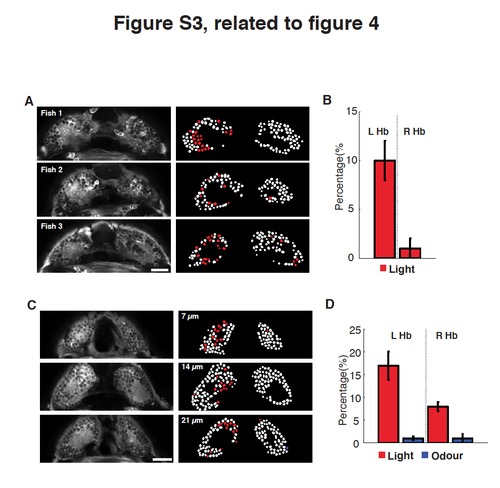
Dark-reared fish and fish with olfactory inputs removed show no change in lateralization of functional sensory responses. (A-D) Examples (A) of a two-photon images of a single planes of the dHb (at 14 μm depth), where the majority of light responses are localised, of three Tg(elavl3:GCaMP5G) 4 dpf dark- reared fish (left). Corresponding colour-coded calcium signals in response to a light stimuli (right). Light responding neurons are in red. Scale bar 20μm. (B) Bar chart showing the percentages of light responding neurons (normalized to the total number of dHb neurons) in the left and right dHb nuclei for two sampled planes (at depths of 7 and 14μm) in multiple dark-reared fish (number of fish=4). (C) Examples of two-photon images of three single planes of the dHb (7, 14 and 21 μm depth) of a Tg(elavl3:GCaMP5G) 4 dpf fish with nose pit removal at 1 dpf, before mitral cell projections reach the Hb, (left). Corresponding colour-coded calcium signals in response to non-lateralized presentation of light and odour (right). Light responding neurons are in red, while odour responses in blue. Scale bar 20μm. (D) Bar charts showing the percentages of light (red) versus odour (blue) responding neurons (normalized to the total number of dHb neurons) in the left and right dHb nuclei for two sampled planes (at 7 and 14μm, number of fish=6). Functional asymmetry of light responses is still present after olfactory pit removal. Error bars are SEM. |