
Fig. 2
- ID
- ZDB-FIG-140512-45
- Publication
- Dreosti et al., 2014 - Left-right asymmetry is required for the habenulae to respond to both visual and olfactory stimuli
- Other Figures
- All Figure Page
- Back to All Figure Page
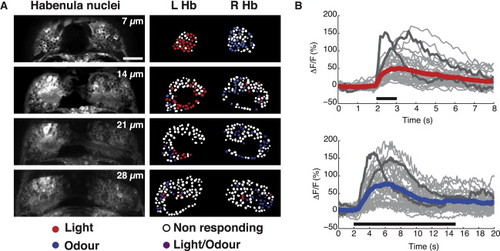
Functional Responses of Habenular Neurons to Visual and Odor Stimuli (A) Raw images of four z planes (at 7, 14, 21, and 28 μm depth from surface) of the dHb of a 4 dpf Tg(elavl3:GCaMP5G) wild-type fry. In the right panels, dHb neuron cell bodies, indicated as regions of interest (ROIs), are color coded in red, blue, violet, or white dependent upon their response to light, odor, both, or neither, respectively. To quantify the number of dHb neurons responding to light and odor, we analyzed the two most-dorsal planes (at 7 and 14 μm) that contained the majority of responding neurons. Only neurons with amplitude responses greater than 2 SDs from the baseline were considered as responding neurons. Neurons that showed inhibition of activity in response to stimulus presentation are not shown. Scale bar, 20 μm. (B) Graphs showing the time courses (averages of two stimulus presentations) of all individual neurons within one imaging plane, at 14 μm depth, to light (top) and odor (bottom) stimuli. Individual responses are shown in gray, the average of all responses is colored red or blue, and two neurons demonstrating the distinct kinetics of the sensory responses are highlighted in dark gray. The durations of the light and odor stimulation are indicated by the black bars; note the difference in time scale. See also Figure S2. |