
- Title
-
Primary Neuron Culture for Nerve Growth and Axon Guidance Studies in Zebrafish (Danio rerio)
- Authors
- Chen, Z., Lee, H., Henle, S.J., Cheever, T.R., Ekker, S.C., and Henley, J.R.
- Source
- Full text @ PLoS One
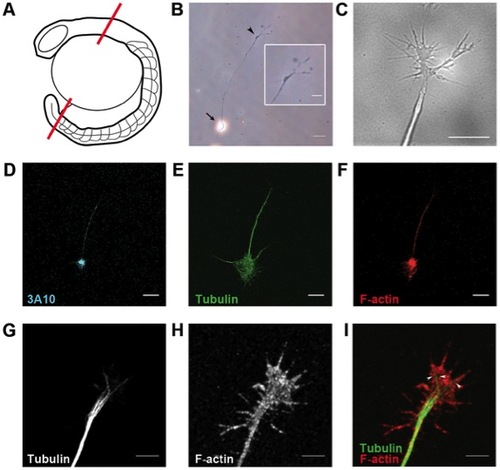
Characterization of zebrafish spinal neurons in culture. (A) Diagram of spinal cord dissection. Red lines indicate cut sites. (B) Dissociated spinal neuron in culture. Inset shows magnified view of growth cone with filopodia. Arrow: neuron cell body. Arrowhead: growth cone at axon tip. (C) Differential interference contrast live imaging shows filopodia and lamellipodia at the axon tip. Immunostaining for (D) neurofilament associated antigen, (E) tubulin, and (F) F-actin. Magnified views of growth cones reveal (G) bundled microtubules projecting along axons and terminating in the growth cone central domain, while (H) F-actin filaments are abundant in the peripheral filopodia and lamellipodia. (I) Merged image of growth cone cytoskeleton organization. Arrowheads: individual microtubules. Scale bars, 20 μm (B), 10 μm (B inset, D–F), 5 μm (C, G–I). |
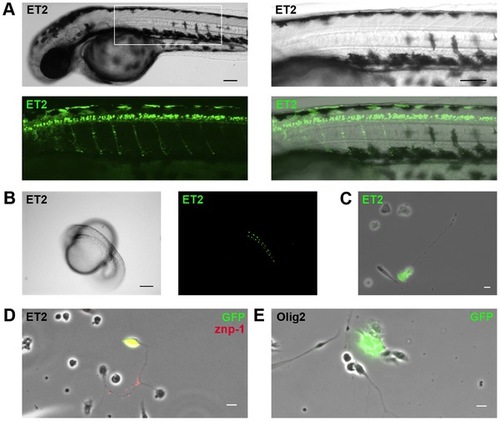
Transgenic neuron culture reveals presence of motor neurons and glial cells. (A) Mn2Et motor neuron reporter line zebrafish at 48 hpf express GFP in spinal cord motor neurons that innervate axial trunk muscles, and at (B) 20 hpf express GFP in paired spinal cord motor neurons. (C) Cultured spinal cord neurons from mn2Et reporter line zebrafish express GFP in vitro. (D) Immunostaining for primary motor neuron antigen znp-1 and GFP confirms presence of motor neurons in mn2Et spinal cultures. (E) Immunostaining for GFP confirms presence of glial cells in Tg(olig2:EGFP) oligodendrocyte precursor reporter line spinal cultures. Scale bars, 50 μm (A) and 10 μm (B, C, D). |

Functional growth characteristics of zebrafish spinal neurons. (A) Diagram of outgrowth assay to measure neurite growth over 1 hr. (B) Spinal neuron growth rates from embryos at 4–6 somite, 12–14 somite, 20–24 somite, and high pec stages. (C) Spinal neuron growth rates on different substrates, and (D) before 10 hr and between 12–24 hr in culture on laminin. Scale bar, 5 μm. *, p<0.05; ns, not significant. |
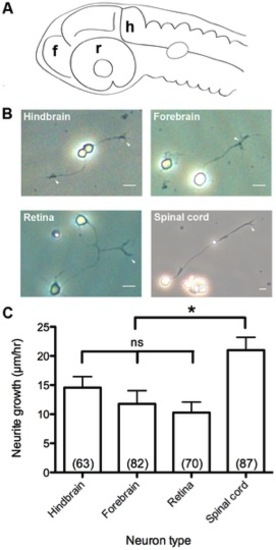
Primary culture of CNS neuron classes and growth rates in vitro. (A) Diagram of CNS neuron harvest sites. f, forebrain. h, hindbrain. r, retina. (B) Dissociated primary cultures of CNS neurons. Arrowheads: growth cones at axon tips. (C) Growth rates of CNS neurons. Scale bar, 10 μm. *, p<0.05; ns, not significant. |

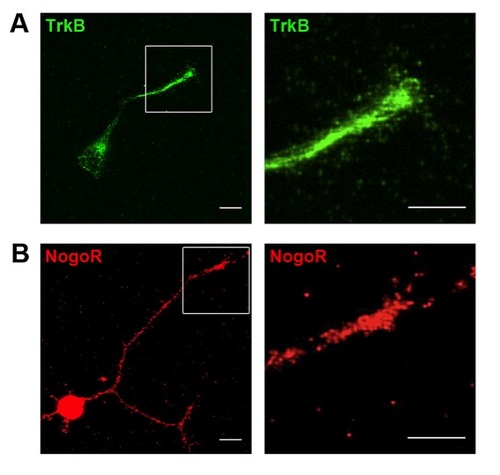
Positive and negative mammalian cues regulate axonal outgrowth. (A) Treatment with BDNF promotes while MAG inhibits axon outgrowth. (B) Staining with antibodies to mammalian BDNF receptor TrkB and MAG receptor NgR reveals high immunoreactivity at spinal neuron growth cones. Scale bar, 5 7mu;m. *, p<0.05. |
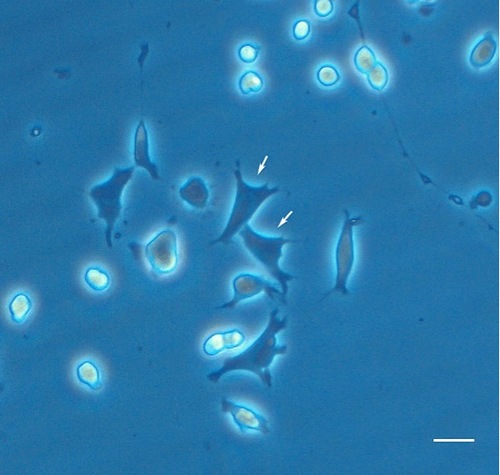
Dissociated spinal neuron cultures show neurons and a mixed population of other cell types, morphologically resembling myoblasts and glial cells. Arrows: myoblasts. Scale bar, 20 μm. |
Staining with antibodies to mammalian BDNF receptor TrkB and MAG receptor NgR reveals high immunoreactivity at spinal neuron cell bodies. |