
Image
|
Figure Caption
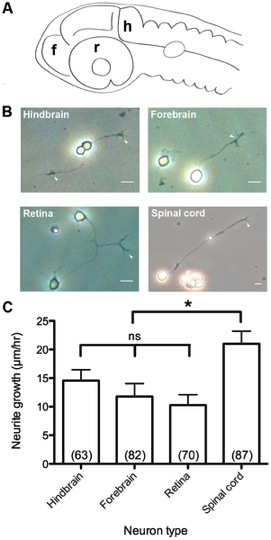
Fig. 4 Primary culture of CNS neuron classes and growth rates in vitro.
(A) Diagram of CNS neuron harvest sites. f, forebrain. h, hindbrain. r, retina. (B) Dissociated primary cultures of CNS neurons. Arrowheads: growth cones at axon tips. (C) Growth rates of CNS neurons. Scale bar, 10 μm. *, p<0.05; ns, not significant.
Acknowledgments
This image is the copyrighted work of the attributed author or publisher, and
ZFIN has permission only to display this image to its users.
Additional permissions should be obtained from the applicable author or publisher of the image.
Full text @ PLoS One