
Fig. 1
- ID
- ZDB-FIG-130424-19
- Publication
- Chen et al., 2013 - Primary Neuron Culture for Nerve Growth and Axon Guidance Studies in Zebrafish (Danio rerio)
- Other Figures
- All Figure Page
- Back to All Figure Page
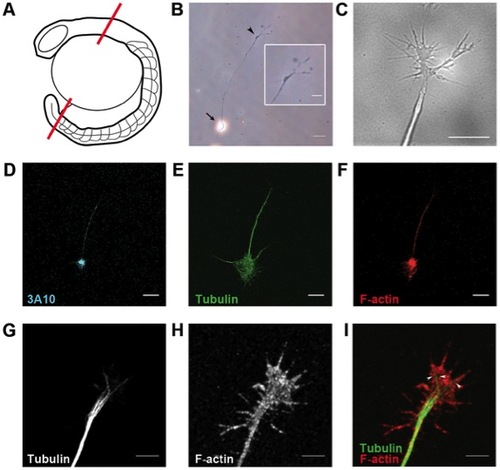
Characterization of zebrafish spinal neurons in culture. (A) Diagram of spinal cord dissection. Red lines indicate cut sites. (B) Dissociated spinal neuron in culture. Inset shows magnified view of growth cone with filopodia. Arrow: neuron cell body. Arrowhead: growth cone at axon tip. (C) Differential interference contrast live imaging shows filopodia and lamellipodia at the axon tip. Immunostaining for (D) neurofilament associated antigen, (E) tubulin, and (F) F-actin. Magnified views of growth cones reveal (G) bundled microtubules projecting along axons and terminating in the growth cone central domain, while (H) F-actin filaments are abundant in the peripheral filopodia and lamellipodia. (I) Merged image of growth cone cytoskeleton organization. Arrowheads: individual microtubules. Scale bars, 20 μm (B), 10 μm (B inset, D–F), 5 μm (C, G–I). |