
Image
|
Figure Caption
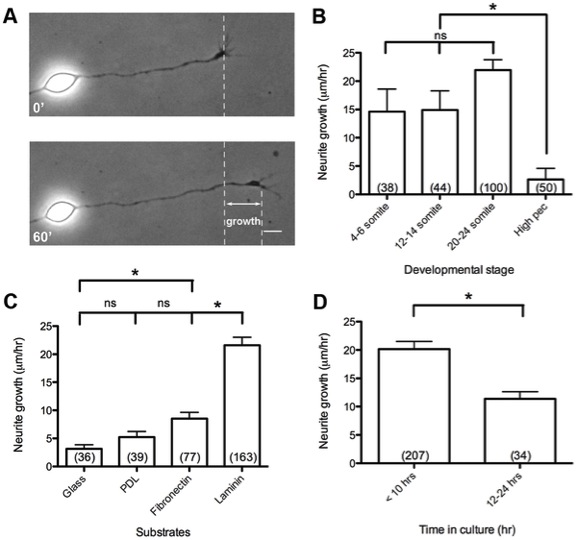
Fig. 3 Functional growth characteristics of zebrafish spinal neurons.
(A) Diagram of outgrowth assay to measure neurite growth over 1 hr. (B) Spinal neuron growth rates from embryos at 4–6 somite, 12–14 somite, 20–24 somite, and high pec stages. (C) Spinal neuron growth rates on different substrates, and (D) before 10 hr and between 12–24 hr in culture on laminin. Scale bar, 5 μm. *, p<0.05; ns, not significant.
Acknowledgments
This image is the copyrighted work of the attributed author or publisher, and
ZFIN has permission only to display this image to its users.
Additional permissions should be obtained from the applicable author or publisher of the image.
Full text @ PLoS One