
- Title
-
Bone Regenerates via Dedifferentiation of Osteoblasts in the Zebrafish Fin
- Authors
- Knopf, F., Hammond, C., Chekuru, A., Kurth, T., Hans, S., Weber, C.W., Mahatma, G., Fisher, S., Brand, M., Schulte-Merker, S., and Weidinger, G.
- Source
- Full text @ Dev. Cell
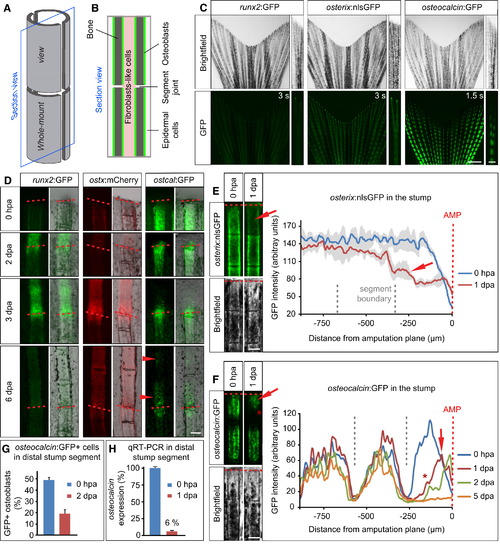
Stump Osteoblasts Downregulate Intermediate and Late Differentiation Markers Early after Fin Amputation (A) Schematic view of a bony fin ray consisting of two concave hemisegments. The bony fin ray is subdivided into segments by segment joints (depicted as a gap here). Whole-mount and longitudinal section views are indicated. (B) Schematic view of a longitudinal section of a fin ray. Fibroblast-like cells are found in between the two hemirays, which are covered by epidermis. Osteoblasts lining the bone are indicated in green. (C) Fins of transgenic zebrafish reporting the osteoblast differentiation status at about 10 weeks of age. runx2:GFP and osterix:nlsGFP expressions are comparatively low, whereas osteocalcin:GFP expression is strong in the center of the fin ray segments. The segment boundaries in osteocalcin:GFP fish are devoid of GFP expression. Exposure times are indicated. Scale bars, 1 mm and 100 μm. (D) Time course of runx2:GFP, osterix:mCherry, and osteocalcin:GFP expression in regenerating fins. For each fish line the same live fin ray is shown at different stages of regeneration under constant exposure time. Arrowheads indicate osteocalcin:GFP expression in differentiating bone segments at 6 dpa. Scale bar, 100 μm. ostx, osterix; ostcal, osteocalcin. (E) Amputated live fin ray of the same osterix:nlsGFP fish at 0 hpa and 1 dpa. Two stump segments proximal to the amputation plane (red dashed line) are shown. Note the reduction of GFP fluorescence in the segment next to the amputation plane at 1 dpa (red arrow). The dark areas in the bright-field view of the fin are due to pigment cells. Pixel intensity ±SEM is plotted on the right (n = 3 fish, three rays per fish). Scale bar, 100 μm. (F) Amputated live fin ray of the same osteocalcin:GFP fish at 0 hpa and 1 dpa. At 1 dpa the GFP level drops in the segment next to the amputation plane (arrow). At the same time the GFP-negative area at the segment boundary becomes larger (asterisk). Pixel intensity measurements of a representative fin ray at different time points during regeneration are shown to the right (n = 5 fish). Of 58 rays, 41 showed GFP downregulation. Scale bar, 100 μm. (G) Quantification of osteocalcin:GFP+ cells in the distal-most stump segment of 0 hpa and 2 dpa fins. The number of GFP+ cells is shown as percentage of Zns 5+ osteoblasts (n0 hpa = 4 fish, 18 sections, 452 GFP+ cells; n2 dpa = 3 fish, 34 sections, 454 GFP+ cells). (H) Quantitative RT-PCR showing decreased levels of endogenous osteocalcin transcription in the distal-most stump segment at 1 dpa (n = 11 fish each). See also Figure S1. EXPRESSION / LABELING:
|

Stump Osteoblasts Induce Markers of Osteoblast Progenitors and Lose Their Differentiated Morphology (A) Whole-mount in situ hybridization against runx2b in wild-type fins at 0 hpa and 1 dpa (n = 5 fish each). Scale bar, 200 μm. (B) Whole-mount in situ hybridization against gfp in runx2:GFP fins at 0 hpa and 1 dpa (n = 5 fish each). Scale bar, 200 μm. (C) The extracellular matrix protein Tenascin is not expressed in osteoblasts on the inner and outer surface of the bone at 0 hpa (n = 2 fish, 19/21 sections) but is detectable at 1 dpa in distal stump osteoblasts on both sides of the bone as well as in intraray fibroblast-like cells (n = 5 fish, 48/48 sections). Stump osteoblasts adopt a rounded shape at 1 dpa and are identified by the presence of Zns 5, which is primarily localized at the cell surface. Scale bars, 10 μm. (D) Ultrastructural changes of osteoblasts after amputation. Toluidine blue staining and corresponding transmission electron micrographs of uncut and 1 dpa fins. Some cells can be detected covering the stump bone (black arrowhead in Toluidine blue staining). Nuc, nucleus; ECM, extracellular matrix; Epid, epidermis; BM, basal membrane. Scale bars, 20 μm (Toluidine blue stainings) and 2 μm (TEMs). EXPRESSION / LABELING:
|

Stump Osteoblasts Proliferate in an FGF-Dependent Manner (A) osteocalcin:GFP+ osteoblasts are capable of dividing after amputation. Frames from a movie obtained from an osteocalcin:GFP; Histone 2a-mCherry transgenic fish fin ray at 1 dpa. Times are indicated (hours:minutes). Scale bar, 20 μm. (B–D) GFP+ and GFP- stump osteoblasts incorporate BrdU (1 hr pulse) in osteocalcin:GFP fish at 1 dpa. (B) Overview. (C) A BrdU+ osteoblast that is Zns 5+ but negative for GFP (arrow) (n = 4 fish, 37/44 sections). Also note the GFP+ cell located distally to the amputation plane (asterisk). (D) A BrdU+ osteoblast that is positive for Zns 5 and GFP (arrowhead) (n = 4 fish, 5/17 sections). Scale bars, 50 μm (B) and 10 μm (C and D). (E) Proliferation of Zns 5+ cells in the distal stump (0–350 μm proximal to the amputation plane at 2 dpa or equivalent area in uncut fins) is highly upregulated at 2 dpa as indicated by BrdU incorporation (5 mM for 9 hr). Error bars represent SEM. Student′s t test, p = 0.021 (nuncut = 3 fish with 31 sections; n2 dpa = 3 fish with 43 sections). (F) Quantification of the proliferative response of stump osteoblasts at 3 dpa. Average number +SEM of BrdU+ Zns 5+ cells (45 min BrdU pulse) per section is shown in bins of 175 μm along the proximal-distal axis (n = 5 fish each, uncut: 214 sections; 3 dpa: 284 sections). Student′s t test, *p < 0.05, ***p < 0.001. (G) Inhibition of FGF signaling by the FGFR1 inhibitor SU5402 significantly downregulates proliferation in distal stump osteoblasts at 2 dpa, as determined by BrdU incorporation (5 mM for 9 hr). Error bars represent SEM. Student′s t test, **p = 0.0013 (nDMSO = 4 fish with 43 sections; nSU5402 = 4 fish with 40 sections). See also Figure S2. EXPRESSION / LABELING:
|
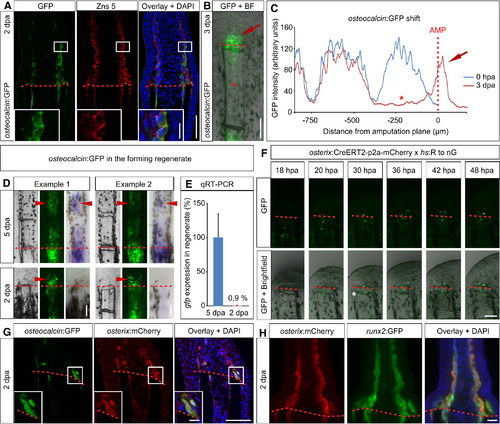
Dedifferentiated Osteoblasts Form Part of the Blastema Where They Redifferentiate (A) osteocalcin:GFP+ Zns 5+ cells accumulate in the lateral parts of the 2 dpa blastema. Inset shows magnification of the boxed area (n = 3 fish, 18/28 sections). Scale bars, 50 μm (overview) and 10 μm (inset). (B) Live regenerating fin of an osteocalcin:GFP fish at 3 dpa. GFP+ cells are present in the blastema (red arrow). Please note that the GFP signal has nearly vanished from the distal-most stump segment (asterisk) (n = 5 fish, 33/42 rays). Scale bar, 100 μm. (C) Intensity measurement of a representative osteocalcin:GFP fish fin ray at 0 hpa and 3 dpa. Downregulation of the GFP signal in the 3 dpa stump is indicated by the asterisk; the appearance of the signal in the blastema is indicated by the red arrow. (D) GFP fluorescence in the blastema of osteocalcin:GFP fish at 2 dpa is due to persistence of GFP. In 5 dpa fins GFP fluorescence is detectable in the mineralizing bone segments of the regenerate, and the same regions express gfp mRNA as detected by whole-mount in situ hybridization (arrowheads) (n = 8 fish, 128/137 fin rays). In the 2 dpa blastema, GFP, but not gfp mRNA, can be detected (arrowheads) (n = 9 fish, 168/168 fin rays). Scale bars, 100 μm. (E) Expression level +SD of gfp mRNA in the 2 dpa blastema relative to the level detected at 5 dpa, as determined by qRT-PCR (n = 11 fish each). (F) GFP-labeled stump osteoblasts in osterix:CreERT2-p2a-mCherry; hs:R to nG double-transgenic fish treated with 4-HT migrate into the forming blastema and cross a segment boundary (white asterisk). Scale bar, 100 µm. See also Figure 5A. (G) In the 2 dpa blastema of osteocalcin:GFP; osterix:mCherry double-transgenic fish, GFP+ cells express mCherry at the same time, indicating redifferentiation of stump-derived osteoblasts along the bone lineage. Inset shows magnification of boxed area (n = 4 fish, 60/82 sections). Scale bars, 50 μm (overview) and 5 µm (inset). (H) osterix:mCherry+ cells express runx2:GFP in the 2 dpa blastema (n = 4 fish, 20/20 sections). Scale bar, 20 μm. See also Figure S3. EXPRESSION / LABELING:
|
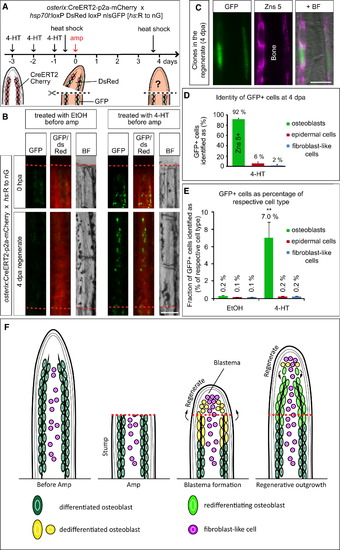
Genetic Fate Mapping of Osteoblasts in the Regenerating Fin (A) Experimental setup for genetic fate mapping using the osterix-driven inducible CreERT2 line (osterix:CreERT2-p2a-mCherry) in combination with the ubiquitous heat-shock inducible red to green responder line (hs:R to nG). (B) Stump osteoblasts contribute to cells in the 4 dpa regenerate. Whole-mount views of fin rays of ethanol (EtOH)-treated and 4-HT-treated fish, photographed after heat shock at 0 hpa and 4 dpa. Note that no recombined cells are found in EtOH-treated fins. Scale bar, 100 μm. (C) GFP+ cells in the regenerate visualized by anti-GFP immunostaining, which detects nuclear and some cytoplasmic GFP expressed from the hs:R to nG transgene, colabel with Zns 5 at 4 dpa. Scale bar, 50 μm. (D) The majority of GFP+ cells in the regenerate are Zns 5+ osteoblasts. Only few cells are found in the epidermis or are fibroblast-like cells. Quantification of sections of 4-HT-treated fins costained with Zns 5 (n = 5 fish, 10 rays, 61 sections with 1155 recombined cells). (E) Distribution of GFP+ cells in osterix:CreERT2-p2a-mCherry; hs:R to nG double-transgenic fins at 4 dpa. Of all cells in the regenerate, 0.4% are GFP+ in EtOH-treated fish versus 7.4% in 4-HT-treated fins. The fraction of GFP+ epidermal cells and fibroblast-like cells does not significantly differ between EtOH and 4-HT-treated fins, whereas 35-fold more GFP+ osteoblasts are found in 4-HT fins. Student′s t test, **p = 0.005 (nEtOH = 5 fish, 10 rays, 55 sections with 79 GFP+ cells; n4-HT = 5 fish, 10 rays, 61 sections with 1155 GFP+ cells). (F) Model of zebrafish fin bone regeneration based on our findings. Within 24 hr after amputation, distally located stump osteoblasts dedifferentiate and start to proliferate. Dedifferentiated osteoblasts migrate distally and form the lateral parts of the blastema. Thus, the blastema is derived from at least two cell types: osteoblasts and intraray fibroblast-like cells. Osteoblast-derived blastema cells do not transdifferentiate but differentiate only into osteoblasts. Thus, bone is regenerated from differentiated, mature osteoblasts. |
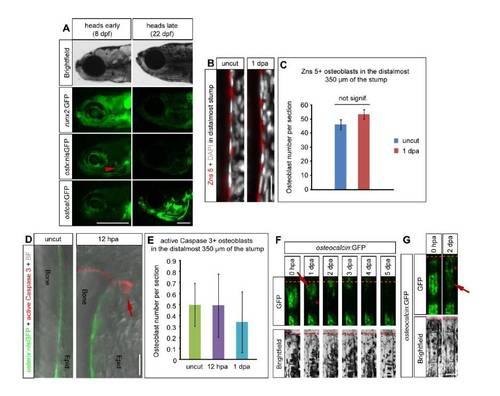
Distally located stump osteoblasts dedifferentiate after amputation. (A) Transgenic fish lines reporting runx2, osterix and osteocalcin promoter activity. During early larval skull development at 8 days post fertilization (dpf), transgenic runx2:GFP zebrafish show high GFP expression, while GFP signal in osterix:nlsGFP fish is restricted to few ossification centers (red arrowhead points to ossifying operculum). At this stage of development osteocalcin:GFP is hardly detectable beyond background fluorescence. In contrast, the forming head skeleton at a later stage (22 dpf) shows strong osteocalcin:GFP expression while runx2:GFP and osterix:nlsGFP expression are comparatively low. Larval heads are shown in brightfield and fluorescence illumination (GFP), the latter with a constant exposure time. Scalebars 500 μm. (B-C) The number and density of Zns 5+ stump osteoblasts does not change after amputation. (B) Zns 5+ and DAPI staining in uncut fins and the distal stump at 1 dpa shows that the density of osteoblasts does not change after amputation. (C) The average number of Zns 5+ osteoblasts in the distal stump (0 – 350 μm proximal to the amputation plane at 1 dpa or equivalent area in uncut fins) is shown ± s.e.m. n = 3 fish each, uncut: 18 sections, 1268 cells, 1 dpa: 19 sections, 1362 cells. Scalebar 20 μm. (D-E) Apoptosis of osterix:nlsGFP+ osteoblasts is a rare event, that does not occur more frequently after amputation. (D) Representative examples of osterix:nlsGFP uncut and 1 dpa fin rays stained with an anti-active Caspase 3 antibody. Apoptosis is not detectable in osteoblasts, but in an epidermal cell at 1 dpa (arrow). BF = Brightfield. (E) The average number of osterix:nlsGFP+/active Caspase 3+ osteoblasts in the distal stump (0 – 350 μm proximal to the amputation plane at 1 dpa or equivalent area in uncut fins) is shown ± s.e.m. nuncut = 4 fish, 46 sections, n12hpa = 3 fish, 26 sections, n1dpa = 4 fish, 26 sections. Scalebar 10 μm. (F-G) Progressive reduction and shift of GFP fluorescence in osteocalcin:GFP fish indicates downregulation of transgene expression and migration of stump osteoblasts towards the amputation plane irrespective of segment boundaries. (F) Timecourse of the same live amputated fin ray as shown in the graph in Fig. 1F. Please note the reduction of GFP fluorescence at 1 dpa (arrow) which is coupled to a progressive distal shift of the signal resulting in a larger GFP negative region close to the segment boundary (asterisk). Scalebar 100 μm. (G) Amputated live fin ray of an osteocalcin:GFP fish at 0 hpa and 2 dpa. Three stump segments proximal to the amputation plane are shown. The distalmost segment has been amputated in its center, which leads to GFP reduction in this and the adjacent stump segment (red arrow). Simultaneously, some GFP signal can be detected covering the former GFP negative segment boundary (asterisk) suggesting that GFP+ cells move distally. n = 5 fish, 43/52 rays. Scalebar 100 μm. EXPRESSION / LABELING:
|
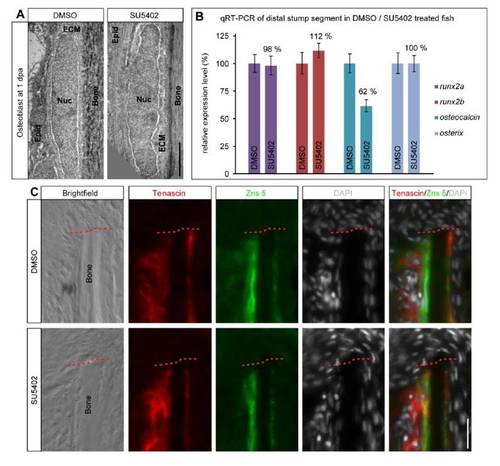
Osteoblast dedifferentiation does not depend on FGF signaling. (A) FGF signaling is not required for ultrastructural changes in distal stump osteoblasts. Transmission electron micrographs of DMSO and SU5402 treated fins at 1 dpa. In DMSO treated fins, osteoblast nuclei (Nuc) have a rounded shape and are surrounded by extracellular matrix (ECM). In SU5402 treated fins osteoblast nuclei are equally rounded and cells are also surrounded by ECM. Epid = epidermis. Scalebar 2 μm. (B) Gene expression levels in distal stump tissue in DMSO versus SU5402 treated fish at 1 dpa. FGF signaling is not required for endogenous runx2a, runx2b and osterix expression. Endogenous osteocalcin levels are not increased but reduced upon FGFR1 inhibition indicating that osteocalcin maintenance but not osteocalcin downregulation depends on FGF signaling. qRT-PCR on distal most stump segment tissue is shown. For each gene, the expression level is shown relative to the expression in the respective DMSO control. Error bars represent standard deviation of triplicates. nDMSO/SU5402 = 12 fish each. (C) Induction of Tenascin in osteoblasts and fibroblast-like cells in the distal stump in response to amputation does not depend on FGF signaling. Anti-Tenascin antibody staining on sections of distal stump tissue of DMSO versus SU5402 treated fins at 1 dpa is shown. Osteoblasts are co-stained with anti-Zns 5 antibody. Tenascin protein is still expressed in the presence of SU5402. Scalebar is 20 μm. nDMSO = 5 fish with 33 sections. nSU5402 = 5 fish with 29 sections. |

Dedifferentiated osteoblasts migrate to the blastema where they re-differentiate (A) Zns 5 can be detected in the forming blastema from 1 dpa on (red arrows). Cryosections of fin rays at different stages of regeneration are shown. The white dotted line demarcates the border of the blastema to the wound epidermis. n0hpa = 3 fish, 43/43 sections, n1dpa = 3 fish, 27/38 sections, n1.5dpa = 1 fish, 17/18 sections, n2dpa = 4 fish, 40/48 sections. Scalebar 20 μm. (B) The number of osteocalcin:GFP+ osteoblasts in the distal stump decreases after amputation. The fraction of Zns 5+ cells expressing GFP in osteocalcin:GFP transgenic fins in the distal stump segment is shown at 0 hpa (49 ± 2 %) and 2 dpa (19 ± 4 %). At 2 dpa, 12 ± 2 % of the Zns 5+ cells in the blastema are also GFP positive. n0 hpa = 4 fish, 18 sections, n2 dpa = 3 fish, 34 sections. Error bars represent s.e.m. 6 (C) osterix:CreERT2-p2a-mCherry fish express CreERT2 specifically in osteoblasts. Fin rays of osterix:CreERT2-p2a-mCherry fish shown as wholemounts (left side) and on cryosections co-stained with Zns 5 (right side). The transgenic line reproduces the pattern of osterix:nlsGFP and osterix:mCherry expression: In uncut fin rays fluorescence is especially high at the growing tips and it is upregulated in the regenerating fin. mCherry expression co-localizes with Zns 5 demonstrating that the expression of the line is restricted to osteoblasts only. As in osterix:nlsGFP and osterix:mCherry fish expression is not detected in cells located directly at the segment joints (asterisk). Scalebar (wholemount) 200 μm, scalebar (section) 20 μm. BF = Brightfield. (D) Genetically labeled GFP+ stump osteoblasts in osterix:CreERT2-p2a-mCherry; hs:R to nG double transgenic fish treated with 4-HT more than a week prior to fin amputation migrate towards the amputation plane and cross a segment boundary (white asterisk) on their way towards the regenerate. The same whole mount fin ray is shown at 6 h intervals in brightfield and GFP fluorescence plus the overlay. The amputation plane is indicated by the red dashed line. Scalebar 100 μm. (E) gfp expression can be detected by whole mount in situ hybridization in the forming regenerate of osterix:nlsGFP fish at 2 dpa. n = 5/5 fins. |
Reprinted from Developmental Cell, 20(5), Knopf, F., Hammond, C., Chekuru, A., Kurth, T., Hans, S., Weber, C.W., Mahatma, G., Fisher, S., Brand, M., Schulte-Merker, S., and Weidinger, G., Bone Regenerates via Dedifferentiation of Osteoblasts in the Zebrafish Fin, 713-724, Copyright (2011) with permission from Elsevier. Full text @ Dev. Cell