
Fig. 1
- ID
- ZDB-FIG-110608-25
- Publication
- Knopf et al., 2011 - Bone Regenerates via Dedifferentiation of Osteoblasts in the Zebrafish Fin
- Other Figures
- All Figure Page
- Back to All Figure Page
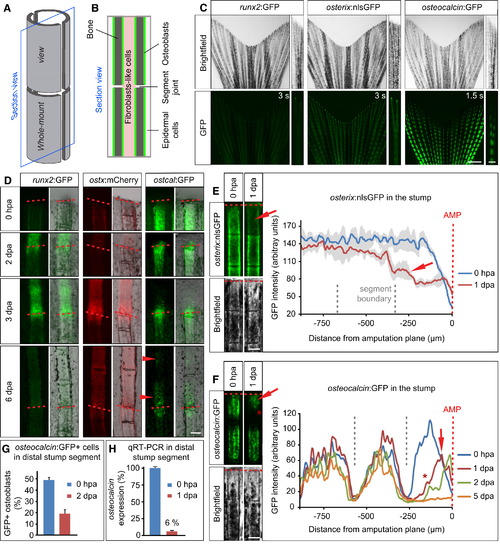
Stump Osteoblasts Downregulate Intermediate and Late Differentiation Markers Early after Fin Amputation (A) Schematic view of a bony fin ray consisting of two concave hemisegments. The bony fin ray is subdivided into segments by segment joints (depicted as a gap here). Whole-mount and longitudinal section views are indicated. (B) Schematic view of a longitudinal section of a fin ray. Fibroblast-like cells are found in between the two hemirays, which are covered by epidermis. Osteoblasts lining the bone are indicated in green. (C) Fins of transgenic zebrafish reporting the osteoblast differentiation status at about 10 weeks of age. runx2:GFP and osterix:nlsGFP expressions are comparatively low, whereas osteocalcin:GFP expression is strong in the center of the fin ray segments. The segment boundaries in osteocalcin:GFP fish are devoid of GFP expression. Exposure times are indicated. Scale bars, 1 mm and 100 μm. (D) Time course of runx2:GFP, osterix:mCherry, and osteocalcin:GFP expression in regenerating fins. For each fish line the same live fin ray is shown at different stages of regeneration under constant exposure time. Arrowheads indicate osteocalcin:GFP expression in differentiating bone segments at 6 dpa. Scale bar, 100 μm. ostx, osterix; ostcal, osteocalcin. (E) Amputated live fin ray of the same osterix:nlsGFP fish at 0 hpa and 1 dpa. Two stump segments proximal to the amputation plane (red dashed line) are shown. Note the reduction of GFP fluorescence in the segment next to the amputation plane at 1 dpa (red arrow). The dark areas in the bright-field view of the fin are due to pigment cells. Pixel intensity ±SEM is plotted on the right (n = 3 fish, three rays per fish). Scale bar, 100 μm. (F) Amputated live fin ray of the same osteocalcin:GFP fish at 0 hpa and 1 dpa. At 1 dpa the GFP level drops in the segment next to the amputation plane (arrow). At the same time the GFP-negative area at the segment boundary becomes larger (asterisk). Pixel intensity measurements of a representative fin ray at different time points during regeneration are shown to the right (n = 5 fish). Of 58 rays, 41 showed GFP downregulation. Scale bar, 100 μm. (G) Quantification of osteocalcin:GFP+ cells in the distal-most stump segment of 0 hpa and 2 dpa fins. The number of GFP+ cells is shown as percentage of Zns 5+ osteoblasts (n0 hpa = 4 fish, 18 sections, 452 GFP+ cells; n2 dpa = 3 fish, 34 sections, 454 GFP+ cells). (H) Quantitative RT-PCR showing decreased levels of endogenous osteocalcin transcription in the distal-most stump segment at 1 dpa (n = 11 fish each). See also Figure S1. |
| Genes: | |
|---|---|
| Fish: | |
| Condition: | |
| Anatomical Terms: | |
| Stage Range: | Days 45-89 to Adult |
Reprinted from Developmental Cell, 20(5), Knopf, F., Hammond, C., Chekuru, A., Kurth, T., Hans, S., Weber, C.W., Mahatma, G., Fisher, S., Brand, M., Schulte-Merker, S., and Weidinger, G., Bone Regenerates via Dedifferentiation of Osteoblasts in the Zebrafish Fin, 713-724, Copyright (2011) with permission from Elsevier. Full text @ Dev. Cell