
- Title
-
Circadian rhythms in the pineal organ persist in zebrafish larvae that lack ventral brain
- Authors
- Noche, R.R., Lu, P.N., Goldstein-Kral, L., Glasgow, E., and Liang, J.O.
- Source
- Full text @ BMC Neurosci.

avpl expression is absent in cyc mutants. Embryos were fixed at (A, B) 24 hours post-fertilization (hpf), (C-F) 46 hpf, and (G-I) 72 hpf and then processed for WISH with antisense probes for the indicated mRNAs. shh-expression in the ventral brain, including the hypothalamus (h, closed arrowhead) is (A) apparent in WT embryos but (B) absent in cyc mutants. (C, E, G, and I) avpl is expressed in the dorsal preoptic area (open arrowheads) and the ventral hypothalamus (closed arrowheads). (D, F, H, and J) Both avpl expression domains are eliminated in cyc mutants. (A-D, G, and H) are lateral views and (E, F, I, and J) are ventral views. The images in panels (C-J) are representative embryos of three independent experiments (n = 3 fish per experiment). avpl expression was also completely absent in cyc mutants at 47 hpf, Zeitgeber Time (ZT) 23.5; 52 hpf, ZT 5.5; 62 hpf, ZT 15.5, and 71.5 hpf, ZT 23.5. No circadian rhythm in avpl expression was detected in the WT larva processed in parallel (n≥4 larva per time point). Scale bars = 50 μm. EXPRESSION / LABELING:
PHENOTYPE:
|

Rhythmic expression of pineal genes persists in cyc mutants. Embryos were raised in a 14:10 h L/D cycle and then sets of embryos were fixed at the indicated stages and ZT and processed for WISH for expression of (A) exorh or (B) aanat2. Note the time of peak (marked with closed arrowheads for exorh) and trough (marked with open arrowheads for exorh) expression is the same between both sets of embryos. (C, D) Quantification of the WISH signal indicates that the amplitude of aanat2 and exorh gene expression is slightly lower in cyc mutants than in their WT siblings. Two-way ANOVA reveals that the difference in the strength of the aanat2 signals are significantly different between cyc and WT (p < 0.01), while the difference in the strength of the exorh signals does not reach significance (p = 0.14). (E, F) In contrast, the expression of otx5, a gene expressed in all pineal cells, is comparable between WT and cyc mutants. (F) At 54 hpf, ZT6 (left graph) and 78 hpf, ZT6 (right graph), length of otx5 gene expression domain is similar between WT and cyc mutants, while the width of the pineal at each stage is slightly bigger in the mutants, perhaps due to changes in the morphology of the cyc head (54 hpf, pineal length, p = 0.11; 54 hpf, pineal width, p = 0.0045; 78 hpf, pineal length, p = 0.52; 78 hpf, pineal width, p = 0.14, n≥3 embryos per time point). In A, B, and E, light conditions are indicated by the white (light period) and black (dark period) bars. All images are dorsal views, anterior to the top. Each experiment was repeated three times, and representative images are shown. Scale bars = 20 μm. EXPRESSION / LABELING:
PHENOTYPE:
|
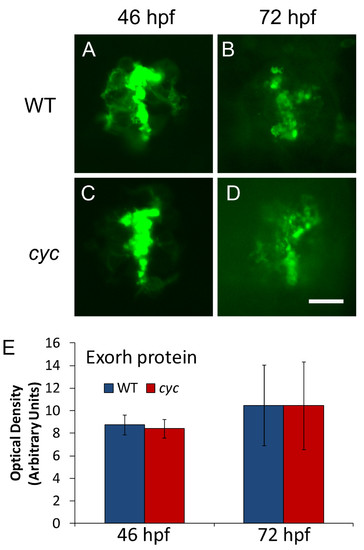
Pineal Exorh protein expression is indistinguishable between cyc mutant and WT embryos. Embryos were fixed and processed for whole mount antibody staining with the anti-Rhodopsin antibody 4D2. Quantification of fluorescent antibody signal shows that optical density of the pineal immunostaining is not significantly different at either time point (46 hpf, ZT 22, n = 10 embryos, p = 0.41; 72 hpf, ZT 0, n = 10 larvae, p = 0.67). Images are dorsal views with anterior to the top. Experiment was repeated two times with similar results, and representative embryos are shown. Scale bar = 20 μm. EXPRESSION / LABELING:
|
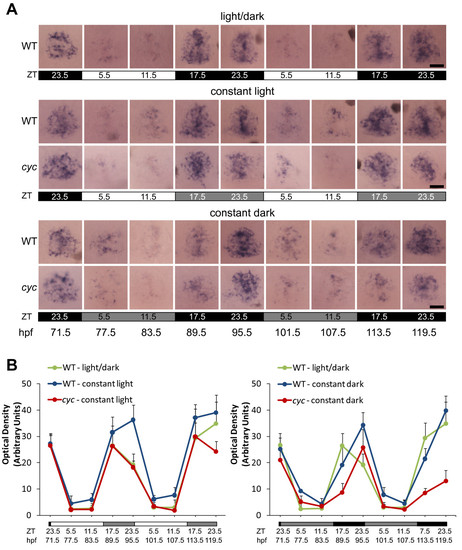
Rhythmic expression of aanat2 persists in constant conditions. Embryos were raised in a 14:10 h L/D cycle. At 71.5 hpf, ZT 23.5, a set of embryos was transferred to constant dark, constant temperature conditions. At 77.5 hpf, ZT 5.5 a set of embryos were transferred to constant light, constant temperature conditions. (A) Embryos were fixed at the indicated stages and ZT and processed for WISH for expression of aanat2. Note the time of peak expression is similar between the cyc embryos and their WT siblings. All images are dorsal views, anterior to the top. (B) Quantification of the WISH signal indicates that the amplitude of aanat2 gene expression is slightly lower in cyc mutants than in their WT siblings in constant conditions. Two-way ANOVA reveals that the differences between aanat2 signal is significantly different between cyc and WT (p < 0.01 for both constant light and constant dark, n≥10 larva per time point, images of 4 larva per each experimental condition and time point used for statistical analysis). For the samples in a L/D cycle, position within the photoperiod is indicated by ZT and light conditions by the white (light period) and black (dark period) bars. For the constant light samples, the original L/D cycle is indicated by the ZT, and the white (original light period) and light grey (original dark period) bars. For the constant dark experiment, the original L/D cycle is indicated by the ZT, and the black (original dark period) and grey (original light period) bars. Experiment was repeated two times with similar results, and representative images from one of the experiments are shown in A. Scale bars = 20 μm. |

Expression of cry genes in zebrafish larvae. WT larvae were fixed at the indicated stages and then processed for WISH with an antisense probe for cry1b or cry3. (A-C) cry1b is expressed in the brain (closed arrowhead) from 3 to 5 dpf. (D, G) At 3 dpf, cry3 is expressed in the brain (closed arrowhead), ear (open arrowhead) and in a region of the retina around the lens (black arrows). Inset in panel G is a higher magnification of the area around the lens. (E, H) At 4 dpf, cry3 is expressed in the brain (closed arrowhead), ear (open arrowhead), and liver (gray arrowhead). (F, I) By 5 dpf, cry3 transcripts are present in the ganglion cell (black arrows) and inner nuclear layers (white arrows) of the retina, and persist in the brain (closed arrowhead) and liver (gray arrowhead). WISH at each stage was repeated two times and representative images are shown (ne5 embryos for the experiment shown). Panels (A-F) are lateral views, anterior to the left and panels (G-I) are dorsal views, anterior to the left. Scale bar in panel I (for all images except G inset) = 500 μm, Scale bar for G inset = 100 μm. EXPRESSION / LABELING:
|
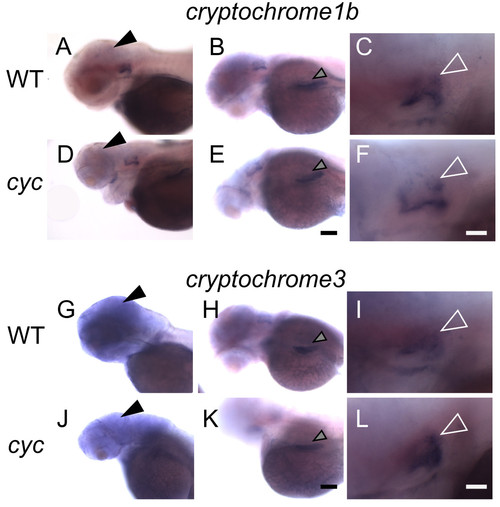
cry gene expression is present in cyc mutants. cyc embryos and their WT siblings were raised in a 14:10 h L/D cycle, fixed at 72 hpf, ZT 0, and then processed for WISH. In both (A-C, G-I) WT embryos and (D-F, J-L) cyc mutants, cry1b and cry3 are expressed in the (A, D, G, J) brain (closed arrowheads), (B, E, H, K) liver (gray arrowheads), and (C, F, I, L) ear (open white arrowheads). Experiment was repeated three times, and representative images are shown. All images are lateral views, anterior to the left. Scale bars = 40 μm for (A-B, D-E, G-H, J-K) and 100 μm for (C, F, I, L). EXPRESSION / LABELING:
|
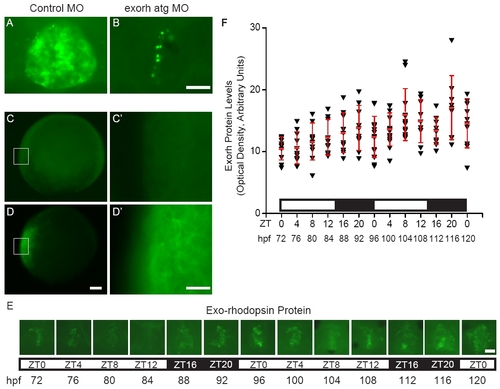
Exorh protein is expressed without a significant rhythm (A, B) Embryos were injected with (A) control or (B) exorh atg MO, fixed at 64 hpf, and processed for fluorescent whole mount immunostaining with the anti-bovine Rhodopsin antibody 4D2. (A) Control embryos have robust fluorescent signal in the pineal organ that is (B) severely reduced in Exorh depleted embryos. (C-C′) Embryos injected with beta-galactosidase mRNA have undetectable levels of immunoreactivity with the 4D2 antibody at 8 hpf. (D-D′) In contrast, embryos injected with exorh mRNA show strong antibody staining at 8 hpf. (E, F) Embryos were fixed in a circadian time course and then processed for 4D2 antibody staining. One-way Analysis of Variance (ANOVA) and Tukey′s analysis revealed no significant changes in pineal Exorh protein levels that followed a daily rhythm (ne9 embryos per time point). However, a few time points were significantly different (p ≤ 0.05) from each other including 72 and 108 hpf, 72 and 116 hpf, 76 and 116 hpf, and 80 and 116 hpf. (A-B, and E) are dorsal views, anterior to the top and (C-D′) are lateral views. (C′) and (D′) are higher magnification images of the regions boxed in (C) and (D), respectively. Scale bars = 20 μm for (A-B, C′, D′, E) and 100 μm for (C, D). |
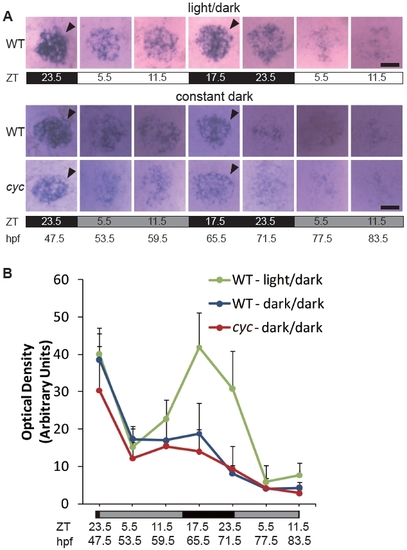
Two days in a L/D cycle is not sufficient to initiate robust circadian cycling of aanat2 expression. Embryos were raised in a 14:10 h L/D cycle. At 47.5 hpf, ZT 23.5, a set of embryos was transferred to constant dark, constant temperature conditions. Embryos were fixed at the indicated stages and ZT and (A) processed for WISH for expression of aanat2 and (B) the WISH signal was quantified. Note the time of peak (closed arrowheads) expression is similar between the cyc embryos and their WT siblings. All images are dorsal views, anterior to the top. For the samples in a L/D cycle, position within the photoperiod is indicated by ZT and light conditions by the white (light period) and black (dark period) bars. For the constant dark samples, the original L/D cycle is indicated by the ZT and the black (original dark period) and dark grey (original light period) bars. Experiment was repeated two times with similar results, and representative images from one of the experiments are shown. Scale bars = 20 μm. |
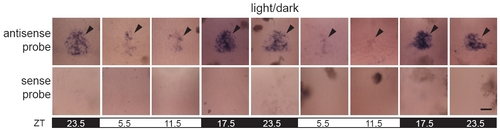
Comparison between larva processed for WISH with antisense and sense probes reveals low background staining. Embryos were raised in a 14:10 h L/D cycle and fixed and processed for WISH using aanat2 antisense or sense probe. Note that the sense probe produces no detectable signal, as it would recognize antisense mRNA, which should not be present. The brown regions are melanocytes in the skin, which have a natural pigment. All images are dorsal views, anterior to the top, with the pineal indicated (closed arrowheads). Position within the photoperiod is indicated by ZT and light conditions by the white (light period) and black (dark period) bars. Representative images are shown. Scale bar = 30 μm. |