
Fig. 4
|
Fig. 4
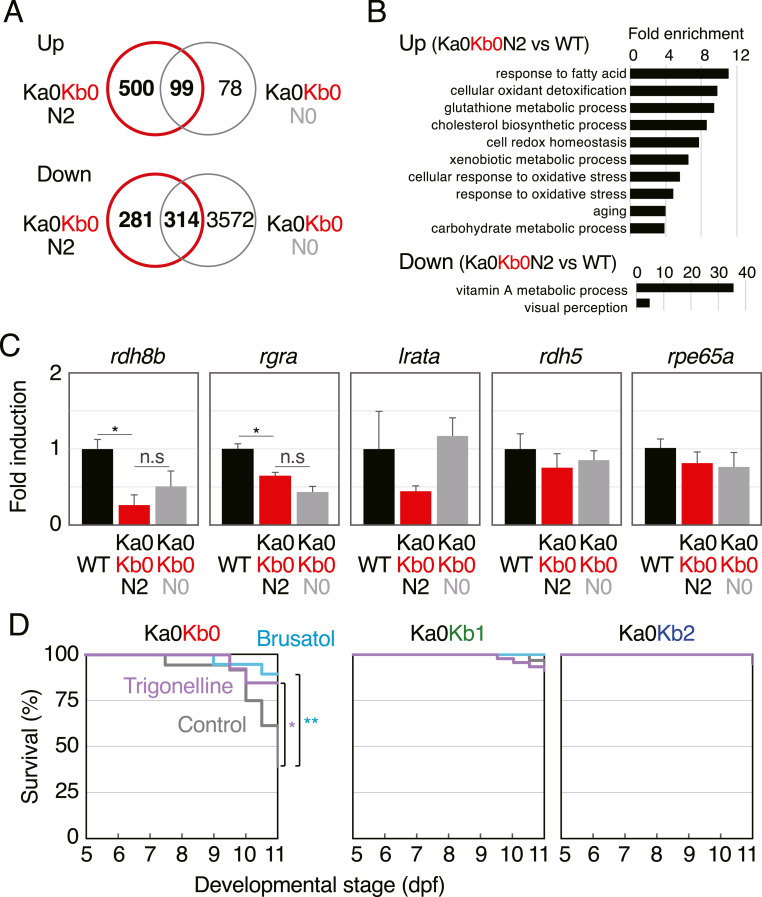
RNA-seq and the effects of Nrf2 inhibitors. (A) Venn diagrams showing upregulated and downregulated genes in 5-dpf Ka0Kb0N2 and Ka0Kb0N0 larvae identified by means of RNA-seq in comparison with wild-type larvae. (B) GO enrichment analysis of the biological processes in keap1a;keap1b-DKO larvae. (C) qRT-PCR analysis of the relative expression of visual cycle genes (rdh8b, rgra, lrata, rdh5, and rpe65a) in wild-type, Ka0Kb0N2, and Ka0Kb0N0 larvae at 5 dpf. Asterisk and n.s. denote significant difference (*p < 0.05) and not significant, respectively. For rpe65a, lrata, and rdh5, one-way analysis of variance did not show significant differences. (D) Survival rates of offspring from Ka0Kb1 parents without feeding. Larvae were treated without (control, gray) or with 0.3 μM trigonelline (purple) or 0.3 μM brusatol (turquoise blue) from 5 to 11 dpf (replaced every 2 days). The tested numbers were as follows: brusatol n = 19, trigonelline n = 13, control n = 36 (Ka0Kb0); brusatol n = 39, trigonelline n = 45, control n = 63 (Ka0Kb1); brusatol n = 19, trigonelline n = 20, control n = 26 (Ka0Kb2). Asterisks indicate significant differences (*p < 0.05, **p < 0.01). (For interpretation of the references to colour in this figure legend, the reader is referred to the Web version of this article.)