IMAGE

Figure 3

ID
ZDB-IMAGE-220515-6
Genes
Source
Figures for Xu et al., 2022
Image
Figure Caption

Figure 3

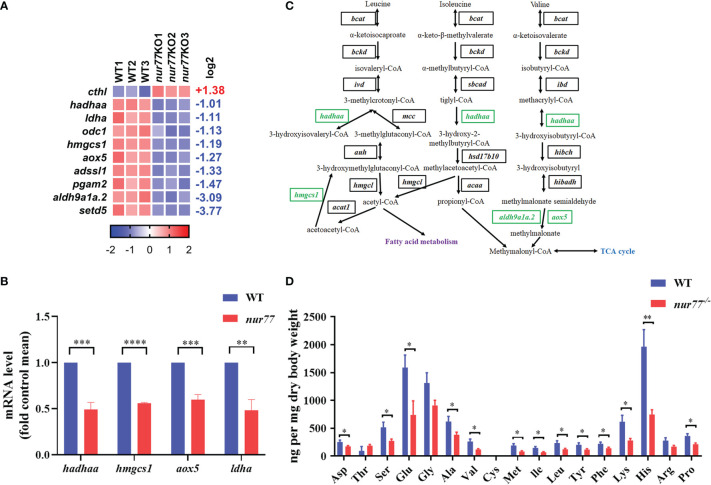
Nur77 regulates amino acid metabolism in zebrafish larvae. (A) Heatmaps of transcripts in amino acid metabolism enrichment. Colors represent high (red), low (blue), or average (white) expression values based on Z-score-normalized fragments per kilobase per million mapped read (FPKM) values for each gene. The Z-score indicators are shown under each map. The fold change (log2) is shown on the right. (B) The validation of the expression levels of differentially expressed genes by qRT-PCR analysis in the categories of amino acid metabolism (n = 3). (C) Disturbed valine, leucine, and isoleucine degradation. Blocks represent transcript-encoded enzymes. Green blocks represent downregulated genes, and black blocks represent unchanged genes. (D) Amino acids compositions in WT and nur77−/− embryos. Results are represented as means with standard errors (n = 3); *p < 0.05; **p < 0.01; ***p < 0.001, ****p < 0.0001 by t-test.

Figure Data
Acknowledgments
This image is the copyrighted work of the attributed author or publisher, and ZFIN has permission only to display this image to its users. Additional permissions should be obtained from the applicable author or publisher of the image. Full text @ Front Endocrinol (Lausanne)